dsh-usage-analytics







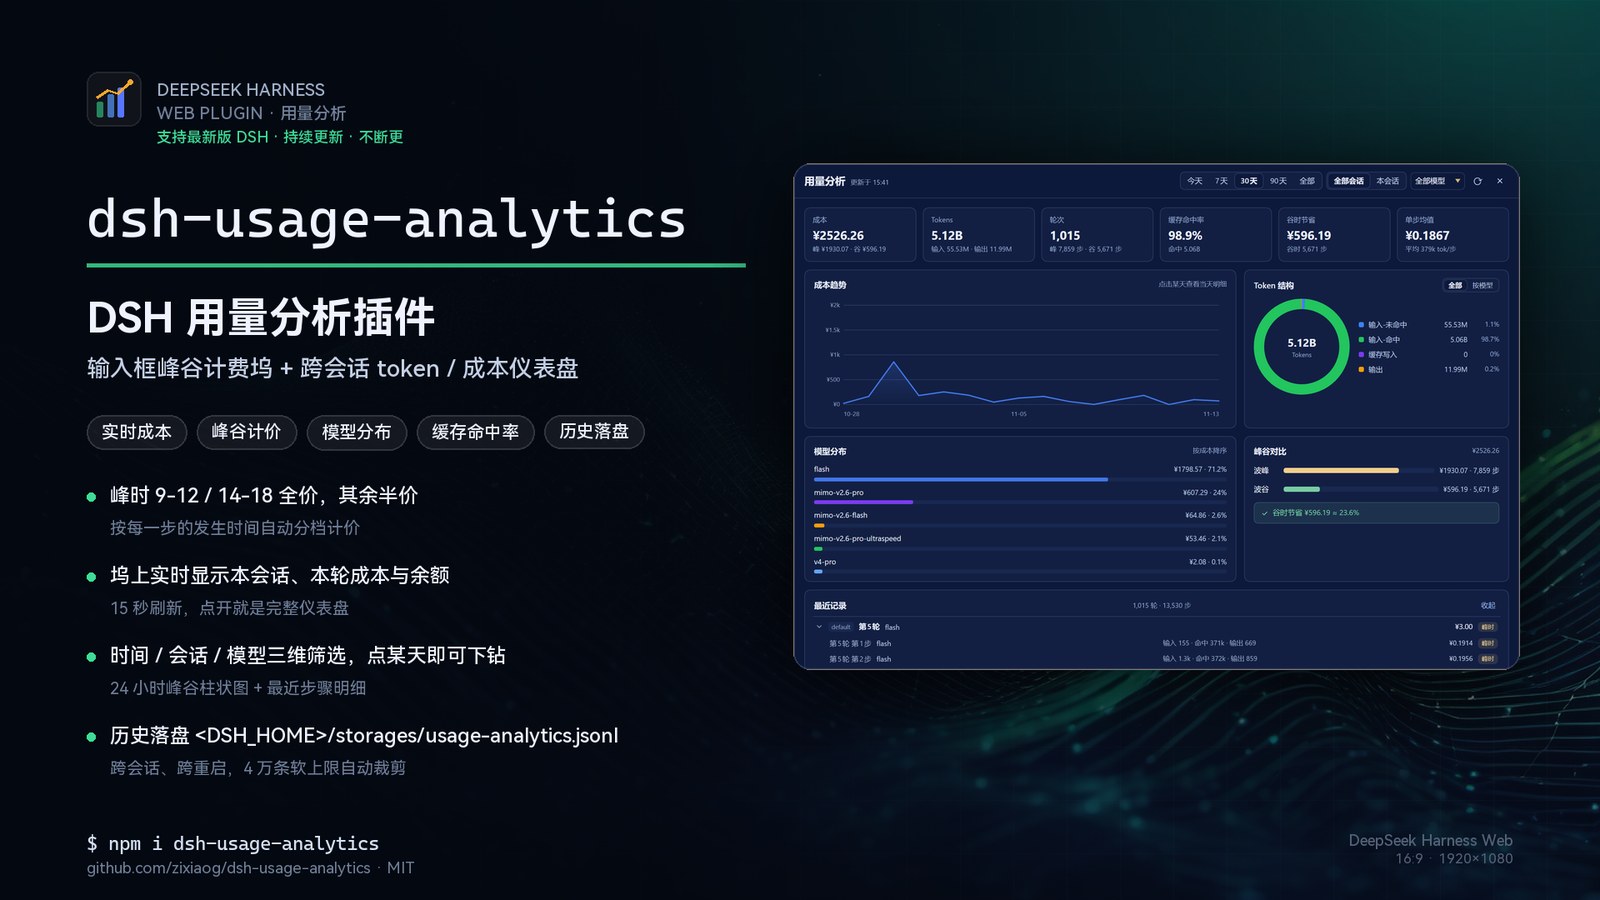
A DeepSeek Harness (DSH) plugin that puts a peak/off-peak billing dock under the composer and a full usage dashboard on top of every session's token and cost history.
The dock tells you, at a glance, what the current conversation has cost, what this turn is costing, and how far away the next price window is. The dashboard answers the bigger question — "where did this week's money go?" — with cost trends, token structure, model mix, a peak/valley split, and turn-by-turn records across all sessions, not just the one that is open.
Built for DSH
0.2.xwith the Web UI. No build step and no runtime dependencies: the host half is plain Node ESM, the client half is a single dynamic module served by DSH.
Supports the latest DSH · continuously updated. Verified against the current
latest(DSH0.2.2-rc.1) and thenextline (0.2.2-rc.2). This plugin is actively maintained: when a DSH release changes a service, event, slot or storage contract it relies on, a matching plugin release follows — see Compatibility & maintenance and CHANGELOG.md.
中文文档:README.zh-CN.md
Features
- Peak/off-peak billing dock under the composer — current price period (peak or valley), progress through that period, countdown to the next switch, accumulated cost for the session, cost of the current turn, and your account balance.
- Cross-session history on disk — every step is appended to
<DSH_HOME>/storages/usage-analytics.jsonl, so history survives restarts, closed sessions and profile reloads instead of disappearing with the chat window. - Dashboard filters — time range (today / 7 / 30 / 90 days / all), session scope (all sessions / this session), and model; every card and chart follows the current filter.
- Charts — cost trend line, 24-hour peak/valley bars for a single day, token-structure donut (cache-miss input, cache-hit input, cache write, output), model distribution bars, and a peak/valley comparison.
- Date drill-down — click a day in the trend chart to narrow everything to that day, step through neighbouring dates with
‹/›, and jump back to the current range with one click. - Recent records — the latest turns grouped by turn, collapsible down to individual steps with input / cache-read / output / cost for each step.
- Account balance — read from the DeepSeek platform account you are signed in with; when that is unavailable the dock and dashboard show
—instead of an error.
Preview
| The dashboard | The dock | A single day |
|---|---|---|
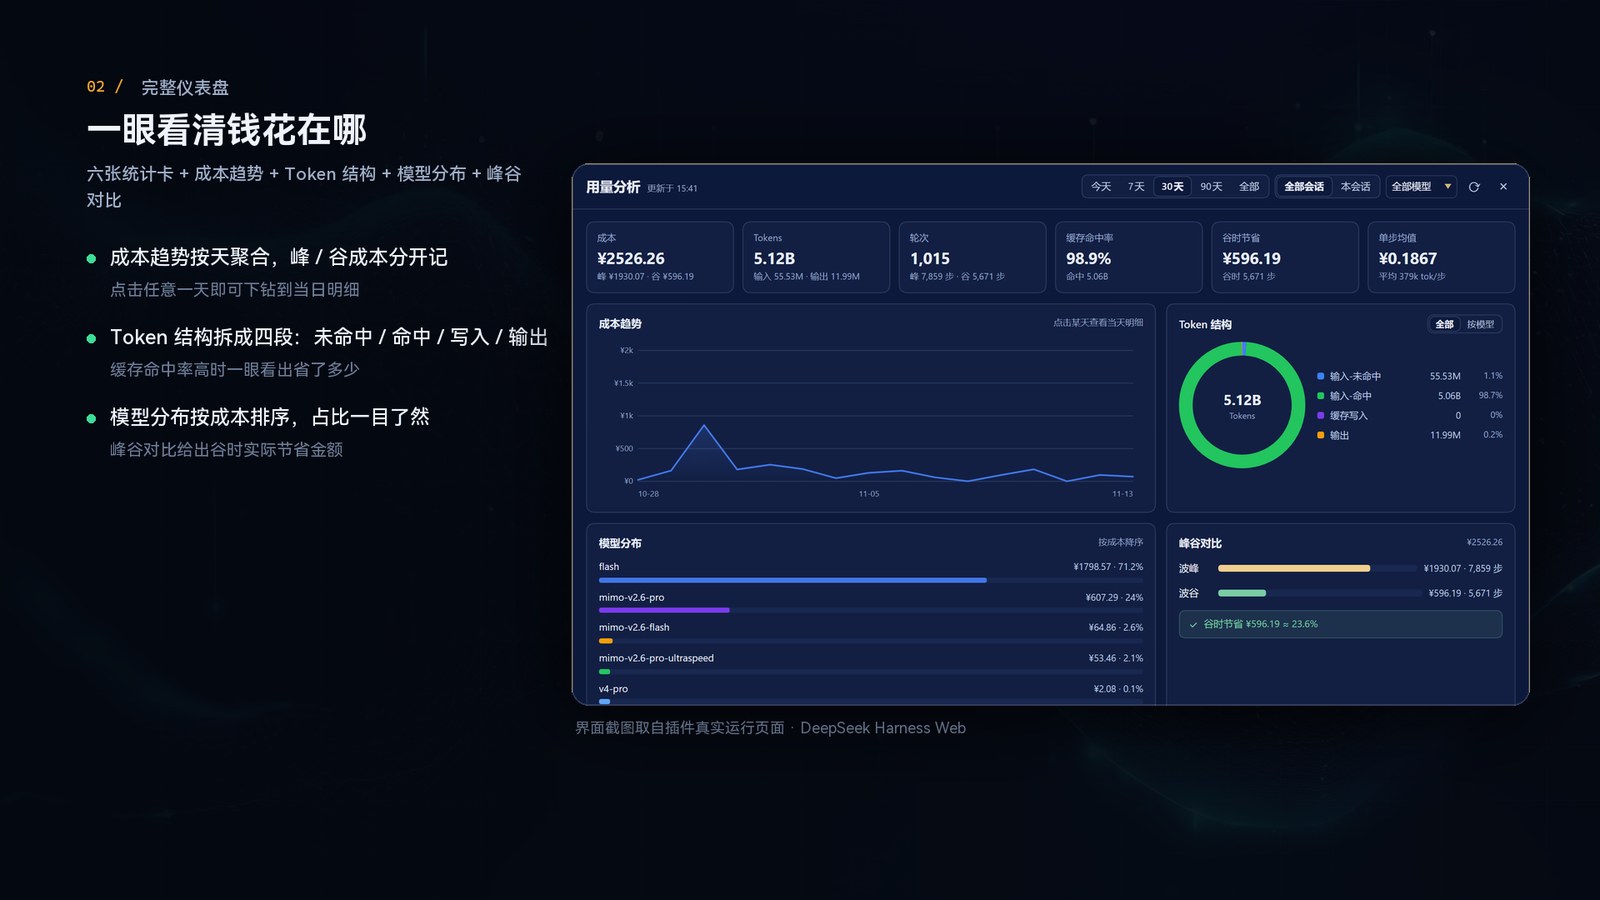 |
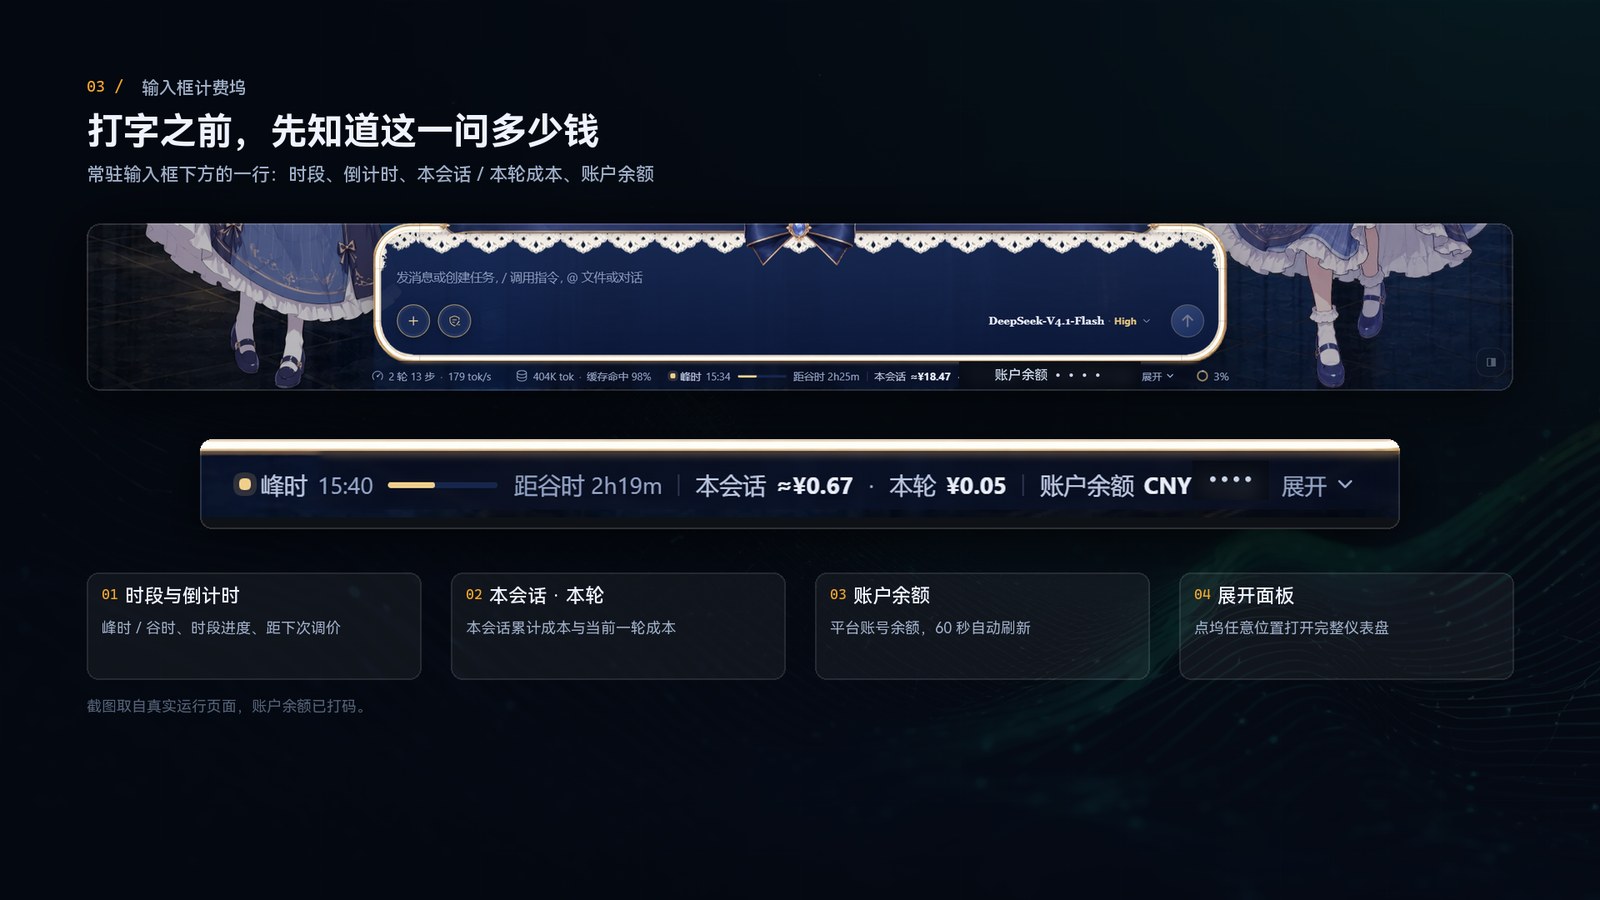 |
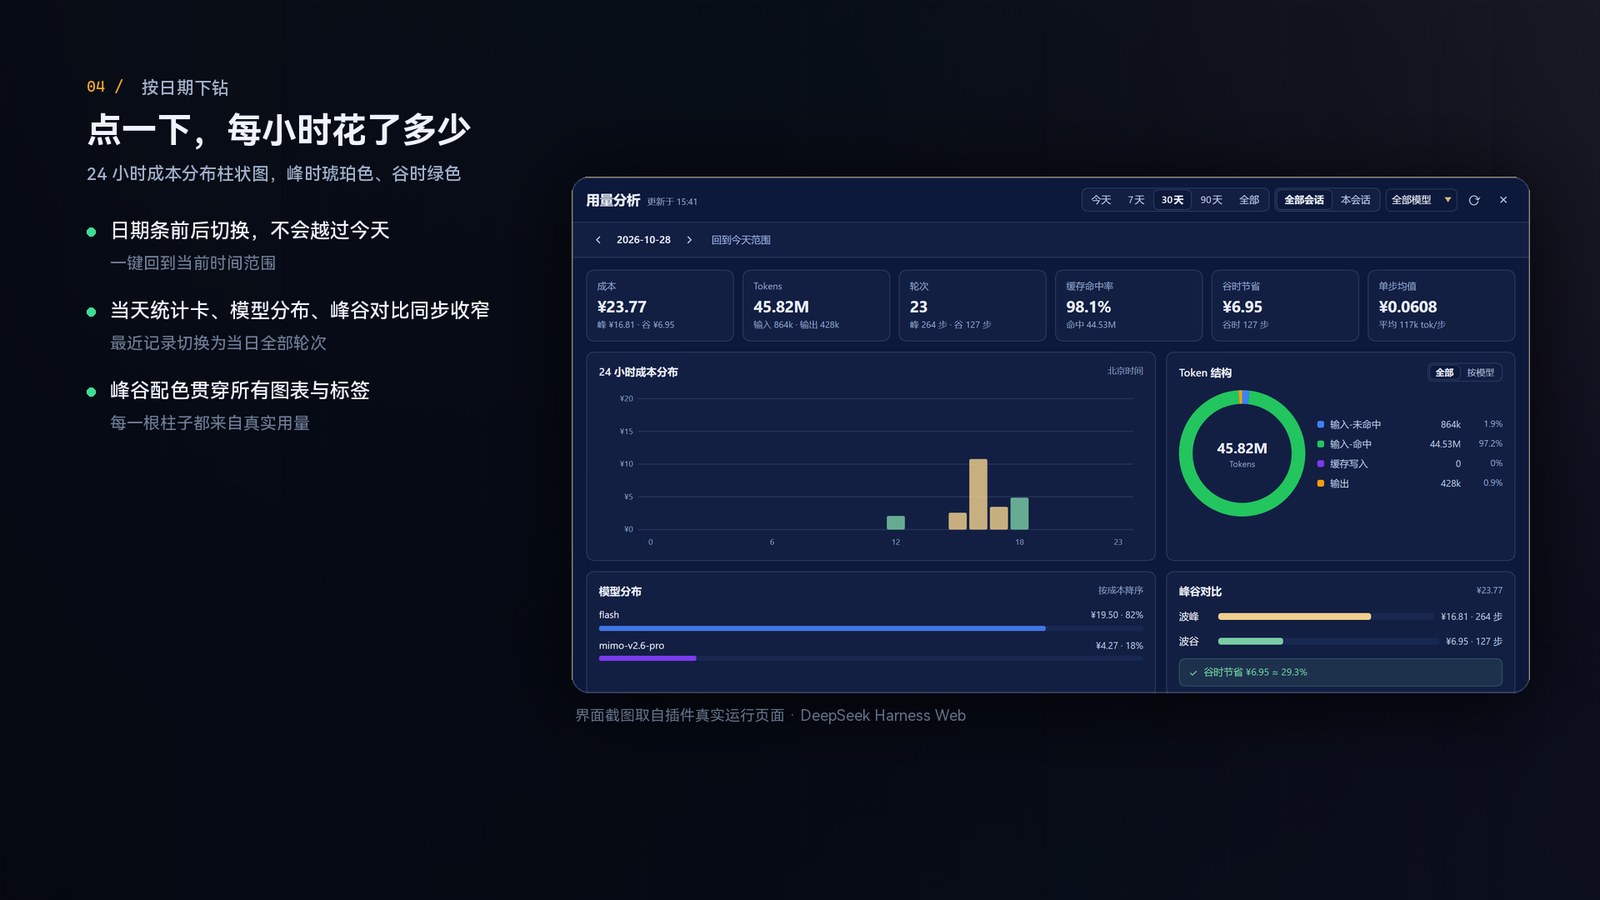 |
| Filters, six stat cards, trend, token mix, model distribution, peak/valley split | One compact row under the composer: period, countdown, session and turn cost, balance | Click a day for 24-hour peak/valley bars |
More screenshots: docs/screenshots/ — this-session scope, cross-session history, token structure and install.
Compatibility & maintenance
| DSH support | 0.2.x — verified against 0.2.2-rc.1 (current latest) and 0.2.2-rc.2 (current next) |
| Update policy | Continuous — the plugin tracks DSH, not the other way round. Every upstream release that changes a contract it uses gets a matching plugin release |
| Contracts relied on | sessionPersistence (session logs), the session/event firehose, webServer routes, deepseekAccount.getBalance, the slot API (conversation.composer.dock, shell.overlay) and DSH theme tokens |
| How drift is caught | The unit suite covers pricing, folding, storage, backfill and the HTTP API; CI runs it on Node 20. A breaking upstream change shows up as a failed check or a slot error before it reaches a release |
| When it breaks anyway | Open an issue with your DSH version and the console error; a patch release follows. Version history is in CHANGELOG.md |
Supported DSH versions are raised, never lowered: a release notes the exact DSH version it was verified against, so you always know what "latest" means for a given plugin version.
The promise is partly automated: a weekly upstream-watch workflow asks npm for the newest @deepseek-ai/dsh and, when it moved past .github/dsh-verified-version, opens an upstream issue with a verification checklist. A new DSH release therefore cannot silently go unverified.
Requirements
| Item | Requirement |
|---|---|
| DSH | 0.2.x with the Web UI (web profile) |
| Node.js | >= 20 (package.json → engines); the host half runs on the Node bundled with DSH |
| Runtime dependencies | none — only Node built-ins and DSH services |
| Browser | any recent browser; the UI is themed entirely from DSH CSS tokens |
| OS | Windows, macOS or Linux (this is a Web UI plugin; it has no platform-specific code) |
Installation
1. From npm (recommended)
dsh plugin --profile <profile> add dsh-usage-analytics
<profile> is the DSH profile whose Web UI you use — for example desktop. To pin a version:
dsh plugin --profile <profile> add dsh-usage-analytics@0.1.0
Restart DSH after the command finishes. The plugin is mounted on the next start and the dock appears under the composer input.
2. From a GitHub Release tarball
Every release publishes a packed tarball (dsh-usage-analytics-<version>.tgz) under Releases. Install it as a local package — no registry access needed:
dsh plugin --profile <profile> add ./dsh-usage-analytics-0.1.0.tgz
Then restart DSH. This is the way to go if the machine cannot reach npm, or if you want to install a build that was never published.
3. Manual install
Extract the release tarball so the package directory ends up at (npm tarballs contain a top-level
package/directory that needs renaming):<profile>/node_modules/dsh-usage-analytics/Add one insert row to the profile's
cordis.patch.yml:- insert: - id: usage-analytics name: 'dsh-usage-analytics'Restart DSH.
The name must match the directory you extracted under node_modules. If you keep the package somewhere else, point the row at that directory with a path relative to the patch file instead, for example name: './vendor/dsh-usage-analytics'.
To uninstall, use the plugin manager — or, for a manual install, remove the row and the directory. The plugin writes no profile settings. Your usage history stays in <DSH_HOME>/storages/usage-analytics.jsonl — delete that file together with its usage-analytics.meta.json companion to start from a clean slate (keeping the meta file alone would leave the backfill watermarks behind).
Usage
The dock
The dock is one compact row under the message composer:
- a coloured dot (amber for peak, green for valley), the current period, a thin progress bar for how much of the period has elapsed, and a countdown to the next switch;
- the accumulated cost of the current session and the cost of the current turn;
- the account balance (
—when it cannot be fetched); - an expand chevron on the right.
Click anywhere on the row to open the dashboard. Live figures refresh every 15 seconds and the balance every 60 seconds; values that have not arrived yet are shown as —, so the row never jumps around while loading.
The dashboard
Open it from the dock. It closes with ×, Esc, or a click on the backdrop.
- Filter bar —
Today / 7 days / 30 days / 90 days / All,All sessions / This session, a model dropdown, a refresh button and the close button. Changing any filter reloads every card and chart. - Six stat cards — cost (with peak / valley split), tokens (with input / output split), turns, cache hit rate, valley savings, and average cost per step.
- Cost trend — one point per day in the current range. Hover for the day's cost; click a day to drill into it.
- Token structure — donut with cache-miss input, cache-hit input, cache write and output; switch between all models and a single model.
- Model distribution — horizontal bars ranked by cost, with share of the total.
- Peak / valley comparison — how much was spent at full price and how much at half price, plus the amount saved by running in valley hours.
- Recent records — the latest turns, each expandable into its steps. On "This session" the records belong to the open conversation; on "All sessions" each turn carries a small session label.
- Date bar — while drilled into a day,
‹ 2026-11-12 ›switches dates (never past today) and Back to today's range leaves the day view.
When the selected range has no usage yet, the charts show a short "no usage recorded yet — say something first" placeholder instead of empty axes.
Data and pricing
Where the data lives
Usage history is stored in one append-only JSONL file:
<DSH_HOME>/storages/usage-analytics.jsonl
- one compact JSON object per step: session and sequence ids, turn/step, timestamp, provider and model, the four token counters, the estimated cost and the peak flag;
- one file spans all sessions and all restarts — it is not tied to a conversation, so closing or deleting a chat does not erase what it cost;
- a small
usage-analytics.meta.jsonsits next to it and remembers each session's backfill watermark and display label; - the file has a soft cap of 40,000 records by default (configurable with
historyLimit); past the cap the oldest records are trimmed automatically, which keeps the dashboard responsive and the file small; - history is backfilled from the session logs that already exist, new steps are captured live as they finish, and the history is re-scanned periodically to pick up anything the live path missed.
Because of the cap, All reaches back as far as the stored records go — usually far more than 90 days for a normal workload, but not literally forever.
How the bill is estimated
Prices come from the official DeepSeek pricing page. Peak/valley is the Beijing-time (UTC+8) schedule:
| Period | When | Price |
|---|---|---|
| Peak | Monday–Friday, 09:00–12:00 and 14:00–18:00 (excluding Chinese public holidays) |
full price |
| Valley | every other time, plus all day Saturday, Sunday and public holidays | 50% (valleyFactor) |
Built-in table, CNY per 1M tokens (peak / off-peak):
| Model | Input (cache hit) | Input (cache miss) | Output |
|---|---|---|---|
deepseek-flash (incl. deepseek-v4-flash*) |
0.04 / 0.02 |
2 / 1 |
8 / 4 |
deepseek-v4-pro |
0.30 / 0.15 |
9 / 4.5 |
27 / 13.5 |
Every step is classified by its own timestamp and priced as:
cost = missInput × price.input
+ cacheRead × price.cacheRead
+ cacheWrite × price.cacheWrite
+ output × price.output
(then × valleyFactor during valley hours — 0.5 by default)
Two details that are easy to get wrong, and that this table follows:
- Cache hits are the cheap part, and they dominate the token count.
deepseek-flashcache-hit input is ¥0.04/M (peak) versus ¥2/M for a miss — a price table that treats the hit price like a miss price overstates the bill by roughly an order of magnitude. - DeepSeek does not bill cache writes separately; the miss price already covers them, so
cacheWriteis0in the built-in table. - Search and fetch are billed per request, ¥5 per 1,000 successful requests (¥0.005 each), with no peak/valley split. The plugin counts
web_searchquery units andweb_fetchURLs found in the session log and adds them as a separate tool fees line on the peak/valley card; they never enter token counts, step counts or the model distribution. Override the unit price withsearchPerRequest/fetchPerRequestif your contract differs.
Public holidays are the one thing a plugin cannot infer: pass the dates in offPeakDates (see Configuration) to have them billed at the off-peak rate. Without that list, a weekday holiday is treated as an ordinary weekday.
You can override any model through the plugin config (prices) — required for models from other providers (e.g. MiMo), which fall back to the deepseek-flash row until configured.
These amounts are estimates. They are computed locally from the token counts DSH records and the price table in effect at the time. Price changes, public holidays, provider-side rounding or a long-running request that crosses a price boundary can all make the estimate differ from what you are actually charged. The official DeepSeek bill is always the source of truth.
History is re-priced automatically. Every stored step carries the price-table version it was priced with; when a plugin upgrade changes the table, existing records are recalculated from their stored token counts on the next start and written back once. Token counts are never rewritten.
Configuration
Configuration is optional — the defaults work out of the box. To change something, add a config block to the plugin row in the profile's cordis.patch.yml:
- insert:
    - id: usage-analytics
      name: 'dsh-usage-analytics'
config:
prices:
deepseek-chat:
input: 2.0 # CNY / 1M cache-miss input tokens
cacheRead: 0.5 # CNY / 1M cache-hit input tokens
cacheWrite: 2.0 # CNY / 1M cache-write input tokens
output: 8.0 # CNY / 1M output tokens
peakHours: # Beijing time (UTC+8)
- '09:00-12:00'
- '14:00-18:00'
storagePath: '/path/to/usage-analytics.jsonl' # omit for <DSH_HOME>/storages/...
debug: false
The prices above are the built-in defaults for deepseek-chat, shown as an illustration — set them to whatever you are actually charged.
| Key | Type | Default | Meaning |
|---|---|---|---|
prices |
object | built-in table | Per-model token prices in CNY per 1M tokens, with input, cacheRead, cacheWrite and output. An entry replaces that model's built-in row as a whole — include all four fields, since omitted ones become 0. |
peakHours |
string array | 09:00-12:00, 14:00-18:00 on weekdays |
Windows billed at full price in Beijing time; everything outside them is valley time. A peakWindows array of [startMinute, endMinute] pairs is accepted as an alternative and wins when both are valid. |
storagePath |
string | <DSH_HOME>/storages/usage-analytics.jsonl |
History file. An absolute path is used as-is; a relative one is resolved under DSH_HOME (so storages/usage-analytics.jsonl stays inside the DSH data directory). A directory path, or the storageDir key, is also accepted. |
debug |
boolean | false |
Writes verbose host-side logging (backfill progress, pricing decisions, balance failures). Leave it off unless you are diagnosing something. |
historyLimit |
number | 40000 |
Soft cap on stored step records (minimum 1000). Past the cap, the oldest records are trimmed. |
peakDays |
number array | [1, 2, 3, 4, 5] |
Weekdays that can be peak, using Date#getUTCDay numbering (0 = Sunday … 6 = Saturday). With the default, weekends are valley all day. |
offPeakDates |
string array | [] |
Beijing-time dates (YYYY-MM-DD) billed at the off-peak rate all day, e.g. Chinese public holidays: ['2026-10-01', '2026-10-02']. |
searchPerRequest |
number | 0.005 |
CNY per search request, counted from web_search tool calls (query units). |
fetchPerRequest |
number | 0.005 |
CNY per fetch request, counted from web_fetch tool calls (URL units). |
valleyFactor |
number | 0.5 |
Multiplier applied to the price in valley hours, clamped to 0–1. |
A config block is replaced as a whole, not merged: if you override one key, restate the others you care about or leave them at their defaults. After editing the file, restart DSH (or disable/enable the plugin) for the change to take effect.
If you installed through dsh plugin add, the row already exists — edit its config in place instead of adding a second row.
How it works
flowchart LR
  A[DSH session logs] -->|sessionPersistence backfill| B[Host half<br/>index.js + lib]
  C[Session events] -->|incremental append| B
  B --> D[(storages/usage-analytics.jsonl<br/>soft cap 40,000)]
  B -->|GET /usage-dashboard/api/*| E[Client half<br/>client.js]
  E --> F[Dock under composer]
  E --> G[Full-screen dashboard]
  B -->|balance lookup| H[DeepSeek platform account]
The host half backfills existing history on start, captures new steps as they finish, prices them with the peak/valley schedule, and serves the result over a small same-origin HTTP API. The client half registers two slots: the compact dock under conversation.composer.dock and the dashboard inside shell.overlay. The only files the plugin writes are the history file and its small meta companion (plus normal DSH logs while debug is on), and chat content is never uploaded.
The full design — collection, retention, pricing, API and client structure — is in docs/DESIGN.md.
Development
There is no build step. The host half is ESM and is loaded directly; the client half is a window.__ModuleLoader__ dynamic module, loaded as-is by the browser.
npm test        # node scripts/test.mjs — the node:test suites in one process
npm run check   # node scripts/check.mjs
npm test imports the node:test suites and runs them in a single process (which also works where spawning test workers is not available); npm run check runs the static checks (syntax, JSON validity, manifest consistency). Both must pass before a PR is merged — the CI workflow does exactly the same on Node 20.
To try a local change: install the directory into a test profile, edit client.js and reload the page, or edit the host files and restart DSH (or disable/enable the plugin row) so the new host code is mounted.
Development notes, code layout and the manual test checklist are in CONTRIBUTING.md.
Known limitations
- The first scan reads session logs. Backfill decodes existing session history under a time budget, so after installing (or after deleting the history files) a large profile converges over a few sync rounds; later starts only catch up on new steps.
- Balance needs a signed-in DeepSeek account. When DSH has no platform session, or the balance endpoint cannot be reached, the UI shows
—and does not raise an error. - Costs are estimates. See How the bill is estimated; the official bill always wins.
- A few cents of drift are expected. The platform usage page lags ~5 minutes, the plugin's own backfill runs on a 60-second cycle, failed
web_search/web_fetchcalls are still counted locally (the platform only bills successful ones), and Search/Fetch fees are estimated from tool calls rather than read from the bill. On a normal day the gap is under ~1%; the plugin exposesmodelCostandfeeCostseparately so you can see which part moved. - History is capped. The default 40,000-record soft cap (
historyLimit) trims the oldest steps, so theAllrange is bounded by what is still stored. - Only usage DSH records is counted. Tokens spent outside this DSH profile, or by other tools sharing the same account, do not appear here.
- DSH internals can move. The plugin targets DSH
0.2.xservice and storage contracts; a DSH upgrade that changes them may require a matching plugin update.
License
MIT © 2026 dsh-usage-analytics contributors
No comments yet. Be the first to write one.