dsh-testhud


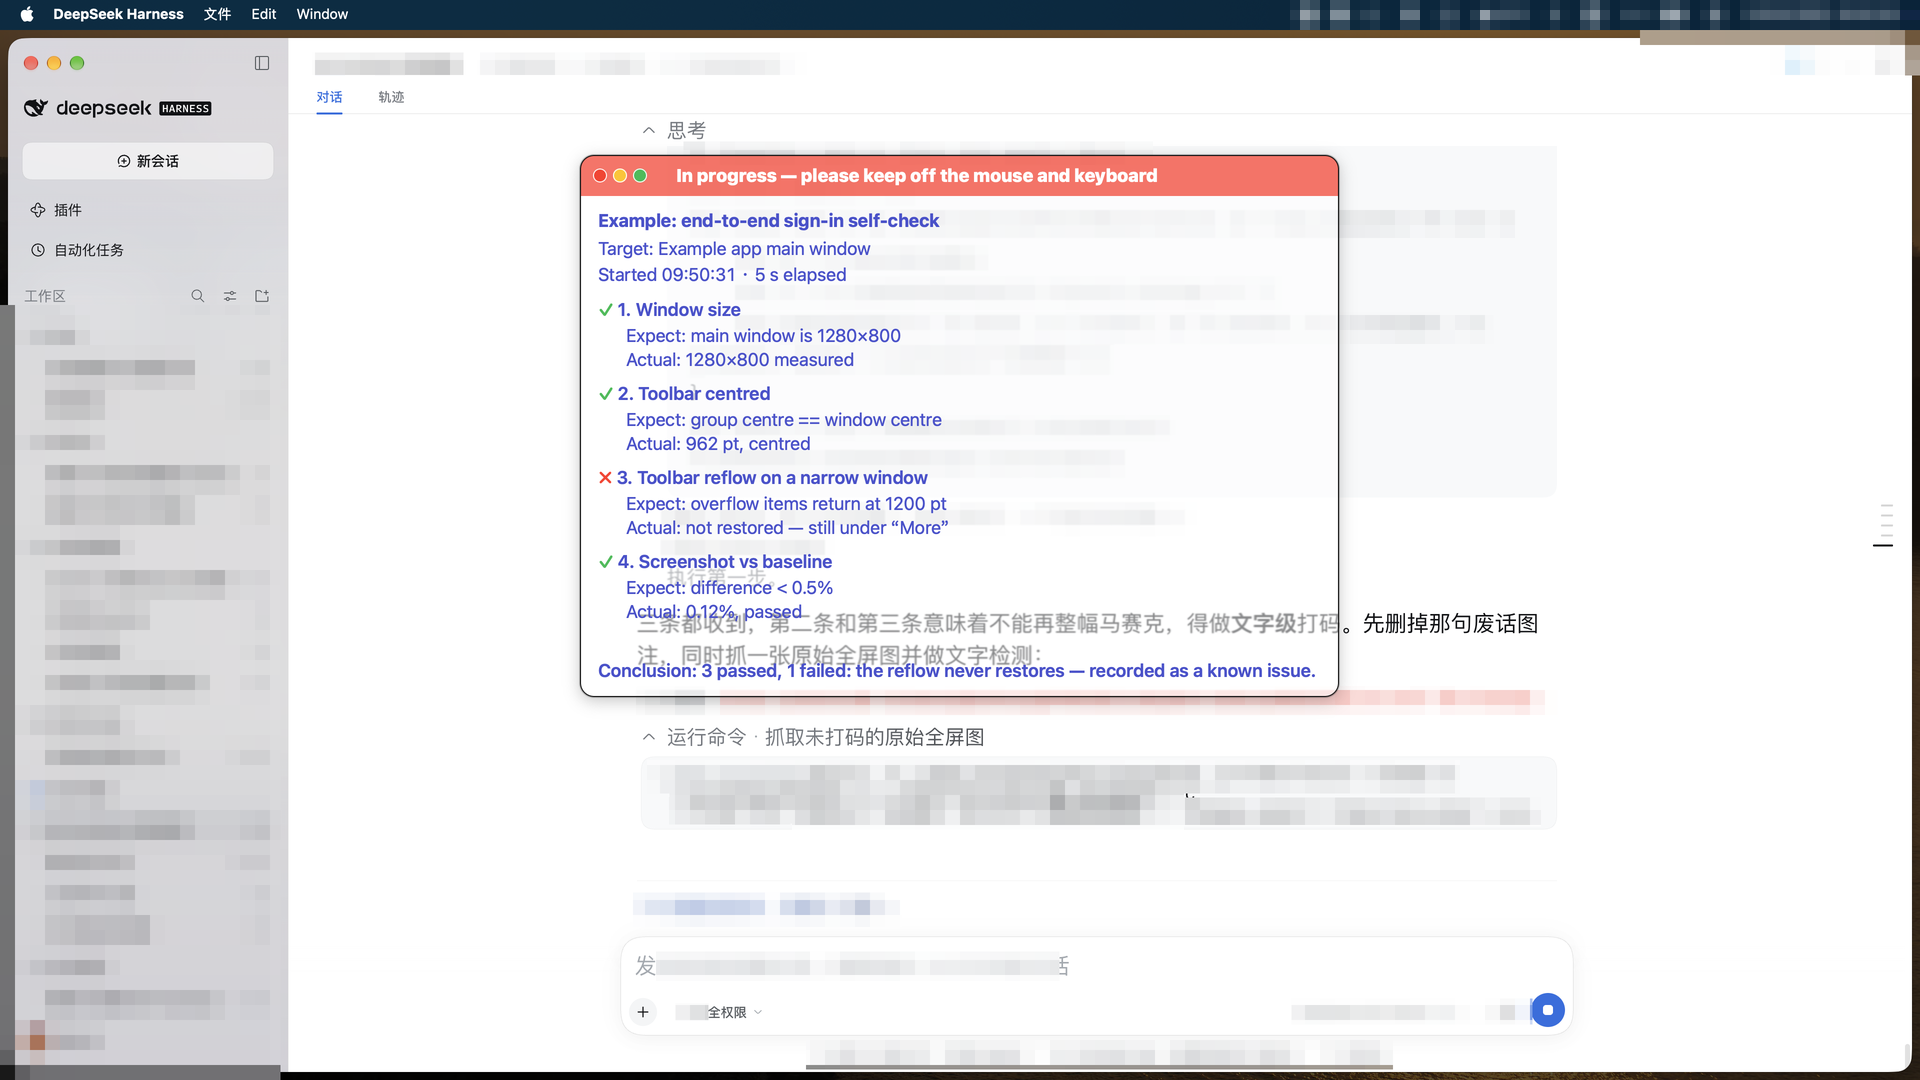
An always-on-top, click-through progress panel for automated tests in DeepSeek Harness (dsh), drawn over the app under test — plus the test_hud tool that drives it from any session.
Why it exists
When an agent drives a GUI, compares screenshots or renders a batch for a few minutes, the human just sits there: they cannot tell which step it is on, what the step expects, whether it already failed, or — the question that actually matters — whether it is safe to touch the mouse and keyboard again.
This panel answers exactly that, on screen, without stealing focus:
- What is being tested — title, target, start time and elapsed seconds.
- Every step, with expectation and actual result — one line each, ✓ / ✗ / ⏳ / •.
- A permanent line about control, at the very top — the panel's own strings are Chinese; this one reads
正在进行:先别动鼠标键盘,以免打断测试while running and✓ 已结束,可以收回鼠标键盘的控制权了when done. It is the heaviest text on the panel and the only line carrying a background: white on swatch red#FF3B30while it is unsafe to touch anything, black on swatch green#34C759once you may take over. The text colour is picked by state, not by contrast — see the swatch section below. - It never gets in the way: click-through (the mouse passes straight through), always on top, not in the Dock and not in ⌘Tab, and it picks the emptiest corner of the screen so it covers as little of the app under test as possible.
- Move it by hand: grab the top colour band and drag. The band is one of only two places that take the mouse (it is the drag handle); everything else stays click-through, and the content area takes the mouse only when content overflows — see "Size and overflow". The cursor turns into an open hand over either place and a closed hand while you hold the button, then back on release — the cursor shape itself is the "you can drag here" hint.
- Three traffic lights at the band's left end, the macOS three: red closes the panel, yellow collapses it down to just the band (click again to restore), green expands it to the usable-area ceiling — full height and full width (click again to go back to fitting the content; height alone often has no room left, since with enough content the natural height already equals the ceiling). Their colours are pinned to the swatch — red
#FF3B30, yellow#FFCC00, green#34C759— each with a 1.0 pt white stroke: the red dot and the red band are now the same swatch colour, so the stroke is the dot's only remaining cue.
Install
dsh plugin --profile <profile> add github:yijiezhong/dsh-testhud   # straight from GitHub
dsh plugin --profile <profile> add link:/path/to/dsh-testhud       # from a local checkout
dsh plugin --profile <profile> add dsh-testhud                     # from npm (published as 0.1.1)
The Desktop app installs the same way (plugin settings); its plugin manager mounts a new bundle live — the row is composed immediately and the host is not restarted. A CLI-launched profile composes its bundle list at boot, so restart once unless your profile reloads patches live.
The package must actually be listed in the profile's dsh.profile.bundles (dsh plugin add does that for you); check that the row really entered the composition with dsh --profile <profile> --dump-config — it prints a # == dsh-testhud layer marker. Every session in that profile then has the test_hud tool and the short prompt convention about reporting long tests.
@deepseek-ai/dsh-tools is declared as a peer dependency: dsh resolves it to the running installation's copy (so the plugin always uses the host's own defineTool) and refuses the whole bundle when the running version falls outside the declared range, instead of half-loading it. The copy in node_modules is only a devDependency, for tests that run outside the host.
Uninstall:
dsh plugin --profile web remove dsh-testhud
The agent tool
action |
What it does | Parameters |
|---|---|---|
start |
Opens a run and launches the panel | title (required), target, anchor |
step |
Reports one check | name (required), expect, actual, state = ok/fail/run/info |
note |
Adds one line at the bottom | text |
done |
Writes the conclusion and ends the run | failed (boolean), conclusion |
stop |
Closes the panel immediately | — |
The panel sizes itself to its content in both directions (see "Size and overflow"), scrolls only the step list while the header stays fixed, and disappears 12 seconds after done — long enough to read the verdict.
The rule
If a verification is running, the panel must be up. Never "just run the commands" without it: during a series of runs, start again after a done and before the next action. Whoever is waiting must be able to see what is being tested and whether it is safe to take back the keyboard.
Clean up afterwards too: done at the end, then quit the app you launched for the test (gracefully, not kill -9) and bring the browser / DSH window back to the front. Do not leave the app under test sitting on screen.
The CLI
Same logic, same progress file, for shell scripts and CI:
testhud start "Movable toolbar layout" "Movable main window" [anchor]
testhud step  "toolbar is centred" "centre == window centre" "962pt, centred" ok
testhud note  "left to the user to decide"
testhud done  ok "3 of 3 checks passed"
testhud stop
testhud status
Configuration
Optional row config in your profile's cordis.patch.yml overrides the plugin row:
- id: testhud
  config:
    announceToAgent: true     # inject the short "report long tests on screen" convention into every session
    defaultAnchor: auto       # auto | center | left | right
    topInset: 155             # how far the top anchors drop below the screen top, in points
Where the panel goes is decided in this order:
- Do not cover the thing under test. The panel scores three positions against the frontmost app's windows and takes the one that overlaps least. This outranks everything below.
- Centre of the screen, when that blocks nothing.
- Otherwise the side — left before right.
Vertically it always sits high: the top edge sits topInset points below the screen top (155 by default), the bottom edge stops above the status bar / Dock (Look.bottomInset, 44 pt). Horizontally it stays off the edges (Look.sideInset, 28 pt) so it cannot sit on a sidebar or a scrollbar. Anchors are auto | center | left | right; the old top-left / top-right names still map to left / right.
topInset exists because the panel usually floats over a browser: the top ~150 pt of the screen are the tab strip, the address bar and the bookmarks bar, and a panel there would cover them. The default (155) starts the panel just below that chrome — level with the page's own header. 0 degrades to "clear the menu bar, then keep a 14 pt screen margin". The value is measured from the screen top (positioning uses the full frame, not visibleFrame), so what you pass is what you get. DSH_TESTHUD_TOP_INSET overrides it for the CLI.
Size and overflow
Both dimensions follow the content (HUD.layout()):
- Width is the widest line at its natural (unwrapped) width plus the left and right insets (
Look.inset, 16 pt), clamped to a floor of 460 pt (Look.minWidth) and a ceiling of the screen's usable width minus 28 pt on each side (Look.sideInset). - Height follows the content, and is exactly the content height while it fits; the ceiling is the span from the panel's top edge (
topInsetbelow the screen top, 155 by default) down to the bottom of the usable area minus 44 pt (Look.bottomInset) — no longer 62% of the screen height. Yellow collapses the panel to just the band; green expands it to that ceiling and to the full usable width.
The height has a ceiling, so with enough content the upper part is pushed outside the visible area. The panel's content area then carries a transparent drag hit layer (the ScrollHandle window plus its ScrollGrip view): press and pull downwards to bring the upper content back (natural scroll direction), and on release it eases back to the bottom over 0.28 s ease-out — "the last line returns to the bottom of the window". The hit layer only exists when content is actually cut off (its height is 0 otherwise), so a panel whose content fits stays fully click-through. The cursor shows an open hand over it and a closed hand while held, reverting on release. Observe it at ~/.dsh/dsh-testhud/scroll.json (scrollY / maxY / atBottom / panning / bouncing / cursor — the last one because screenshots do not contain the mouse pointer, so the cursor can only be verified this way).
Colours come from the Apple swatch only
Every colour on the panel must exist in the Apple swatch — the 22 colours on page 1 of the swatch (Apple色板/1Apple配色色卡.key, on this machine under $HOME/PARA/8.Code/AIDoc/设计规范/): 9 neutrals + 3 blues + 10 functional. The single source of truth in code is ApplePalette in hud/testhud.swift, all built in sRGB (calibrated* constructors shift the values).
Chameleon V2 (2026-10-09): the panel's ground is fully transparent — no fill, no backdrop snapshot; only text and a hairline border remain. Whatever is underneath stays visible, and the panel's own text is kept legible on any backdrop by three things (stroke + shadow + colour):
| Part | Light appearance | Dark appearance |
|---|---|---|
| Panel ground | translucent (alphaFloor 0.50) |
same |
Border (1.0 pt, Look.panelBorderWidth) |
black #000000 |
white #FFFFFF |
| Body (title / step name / conclusion / expect / actual — one colour) | picked adaptively, see below | same |
| Text shadow | off by default (textShadowBlur = 0) |
same |
| Text stroke | off by default (strokeWidthPercent = 0) |
same |
| Step marks | ✓ #34C759 / ✗ #FF3B30 / ⏳ #FF9500 / • same as body |
same |
The body colour is picked adaptively (Theme.pickTextColor, 2026-10-09) — the backdrop is classified into four cases, and within a case only one pairwise contrast comparison is made:
| Backdrop | Picked |
|---|---|
| itself coloured (site blue, warm orange, deep green…) | whichever of black/white contrasts more (a coloured candidate tends to blur into a same-hue backdrop) |
| neutral but mid-luminance (pure mid grey) | black/white (blue only reaches 2.5:1 on mid grey) |
| neutral, bright | the better-contrasting of Apple blue #0071E3 and indigo #5856D6 |
| neutral, dark | the better-contrasting of bright blue #2997FF and mint #00C7BE |
Across eight measured backdrops (white-with-black-text / black-with-white-text / pure white / pure black / mid grey / site blue / warm orange / deep green) it picks indigo / mint / indigo / mint / black / black / black / white, each confirmed legible by eye. Hierarchy no longer rides on grey levels: it is all font weight (one size, four weights).
The shadow takes "the backdrop's pole" (white in the light scheme, black in the dark one): it blends into the backdrop, and its job is to push the backdrop's own strokes out from under the panel's letters. The stroke is off by default (strokeWidthPercent = 0) — three variants were compared side by side: a stroke makes 18 pt glyphs look fat and grubby, whereas a pure shadow stays clean and reads just as well. The capability is kept (set a negative value to enable it).
The band ignores the light/dark split and follows the state: running = red #FF3B30 + white text, done = green #34C759 + black text; the band's opacity is 0.75. The three traffic lights are swatch values too (red #FF3B30, yellow #FFCC00, green #34C759) with a 1.0 pt white stroke. The band is the only opaque piece left.
The step marks are ✓ / ✗ / ⏳ / • and not ✅ / ❌: colour emoji ignore foregroundColor and paint colours of their own, outside the swatch, so the glyph had to change. By the same token, emoji the caller (an agent) writes into a step name, expect or actual are not governed by ApplePalette.
Only one thing is still computed: which appearance to use. It reads the median luminance of the sampled rectangle (not the mean — dense text lifts the mean, which made a dark backdrop with white text look "light" and produced black panel text). The threshold 0.60 is empirically calibrated: what ScreenCaptureKit returns has been tone-mapped (measured: pure white 1.000 comes back as 0.886, the dark grey #1D1D1F at 0.106 comes back as 0.373), so comparing against the textbook 0.5 inverts the decision. The backdrop is sampled every 0.7 s — the rectangle the panel is about to cover, and only that rectangle, plus immediately whenever the frontmost app changes or the panel resizes or changes content.
Two earlier palettes remain in the source unused (banner() / tinted() / textColor(), plus the "translucent ground + backdrop snapshot" route); ask the user before reviving them.
Visual design
The layout follows CRAP deliberately; keep these rules when you edit it:
- Contrast — colour carries two jobs: status (the band and the step marks) and the body colour (swatch blue, which is what separates the panel's text from a black/white backdrop — see the table above). Hierarchy rides on four font weights, never on a second size — every line is
Look.base(18 pt). - Repetition — one left edge for all content (
Look.inset, 16 pt), and only three spacing values: 14 pt between groups, 10 pt between steps, 2–4 pt inside a step. - Alignment — the banner spans the full panel width and its text indents back to the content edge; a step's expect/actual lines use a real
headIndent, not spaces (spaces never line up in a proportional font). - Proximity — header (title / target / timer), steps, and the conclusion are three groups: tight inside, loose between.
Every line is the same size — Look.base (18 pt) in hud/testhud.swift — and the hierarchy comes from weight alone (heavy for the control line, bold for the title and status, semibold for steps, regular for the expect/actual detail). The browser's DSH body text is --dsh-content-font-size (14 px by default, 12–17 settable); the panel sits above it because light text on a translucent dark panel reads smaller than black text on a page. Change base and the whole panel resizes with it. The other layout numbers: 16 pt padding (Look.inset), 14 pt corner radius (Look.cornerRadius), 1.0 pt border.
Requirements
- A dsh host that provides
@deepseek-ai/dsh-tools— declared as a peer (~0.2.0-rc.2at the time of writing), sodefineToolis the host's own copy and a runtime outside the declared range is refused rather than half-loaded. The package has no other runtime dependencies. - macOS for the panel itself (AppKit). The progress file and the tool work anywhere.
- Xcode Command Line Tools for
swiftc— the panel is compiled on first use into~/.dsh/dsh-testhud/bin/testhud(3–4 s in practice on this machine) and reused afterwards, so the package ships source, not binaries. Withoutswiftcthe tool still records every step and still returns the verdict; it just reports that it could not draw the panel.
Development
Inspect, don't guess
bin/testhud-inspect.py is the observation tool for the panel's pixels. It reads the geometry the panel itself exports on every layout (~/.dsh/dsh-testhud/panel-frame.json), crops exactly that rectangle, and reports the panel's internal texture plus every OCR line inside it that does not belong to the panel's own content.
Use it instead of reasoning about panel coordinates from a screenshot: the panel's position and size are dynamic, and inferring them from OCR output mistakes content from outside the panel for text bleeding through. Contrast is computed from colour clusters rather than extreme pixels, and anything measuring under 1.5:1 is reported as an out-of-frame artifact rather than a contrast figure.
When several rounds in a row report "nothing changed", suspect the instrument before changing the subject again. A pixel-identical result across rounds, or several genuinely different implementations all "failing" the same way, are signs that the instrument is broken — not the thing being measured.
Test on a backdrop that contains text
Sample a backdrop with real text under it — a source file, a terminal full of output, a chat transcript. A solid area (blank page, empty terminal) cannot show the failure this panel exists to avoid: its own text fighting the text underneath, same size and similar colour, two layers of type in one place. A clean backdrop proves nothing about it.
# a throwaway profile, so your real one is untouched
dsh --profile hudtest --from-default-profile headless --dump-config > /dev/null
dsh plugin --profile hudtest add link:"$PWD"
dsh --profile hudtest --dump-config | grep -A2 testhud        # the row is composed
dsh --profile hudtest "call test_hud: start, step, done"      # a real session must see and call the tool
rm -rf ~/.dsh/profiles/hudtest                                # clean up
node_modules/@deepseek-ai/dsh-tools is only needed for standalone node lib/index.js smoke tests; inside a dsh process the host resolves it. It is not part of the published package.
How it works
lib/index.js      Cordis host plugin: registers the test_hud tool + a system-prompt section
lib/hud.js        progress file (~/.dsh/test-progress.json) and the panel process (build / start / stop)
hud/testhud.swift the panel itself: borderless NSPanel at .screenSaver level, ignoresMouseEvents, polls the file every 0.4s
                  (plus two small transparent helper windows that cover one region each — the band handle and the
                   content drag hit layer: the panel is click-through as a whole, and ignoresMouseEvents is
                   per-window, so one window cannot be "click-through here, solid there")
bin/testhud.js    CLI over the same core
The progress file schema is deliberately plain JSON, so anything can write it:
{ "title": "…", "target": "…", "status": "running|done|failed", "startedAt": 1789518613.07,
  "steps": [{ "name": "…", "expect": "…", "actual": "…", "state": "ok|fail|run|info" }], "note": "…" }
Limitations
- One panel per machine. The progress file is a single well-known path, so two concurrent test runs share one panel — the last writer wins.
- The panel is click-through by design, with two exceptions: the top colour band (the drag handle — without it there would be no way to move the panel by hand) and, while content overflows, the content drag hit layer. A mouse landing on either grips the panel instead of the app underneath;
stop/donemake it go away. - The band's left 78 points are reserved for the three dots; the band text starts after them, so a long status line cannot run into the dots.
- Dragging leaves the panel wherever you put it —
layout()only keeps the top edge fixed when the height changes, it never snaps back to a candidate position — until the panel process restarts. The drag is clamped to the visible area of the screen the mouse is on: otherwise the panel can be dropped into the dead space between two displays, where nothing is visible and it can never be clicked again. - On a screen already covered by full-screen windows, every corner overlaps something;
autothen falls back to the top-left corner. Pass an explicitanchorto keep the panel away from the area you are testing. - In the worst case the panel's text competes with the backdrop's text: over dense text (a terminal full of output, say) the two layers sit on top of each other. The answer is a translucent ground plus an adaptive body colour: the ground pushes the backdrop back one layer, and the body colour is picked for the backdrop (see "Colours"). To go fully transparent instead (text has to fend for itself): set
Look.transparentPaneltotrue— only in that mode is the text shadow (textShadowBlur) worth turning on. - The panel's own strings are bilingual (the control band,
测试对象:/Target:,期待:/Expect:,实际:/Actual:,结论:/Conclusion:): English when the system's preferred language starts withen, otherwise Chinese;DSH_TESTHUD_LANG=enforces it (used for screenshots and tests). A run's title and step text are whatever the caller wrote.
License
MIT
No comments yet. Be the first to write one.