GPU Radar — DSH plugin
A DSH plugin that answers one question: who is using this machine's GPU, and which model or job owns that memory.
A small badge sits to the left of the input box with live GPU / VRAM / CPU readings. Click it and a panel opens: VRAM is grouped by project, and each project drills down into its processes, the models it has loaded and the jobs it is running. From there you can pause, resume or kill processes, and pin a VRAM budget per project.
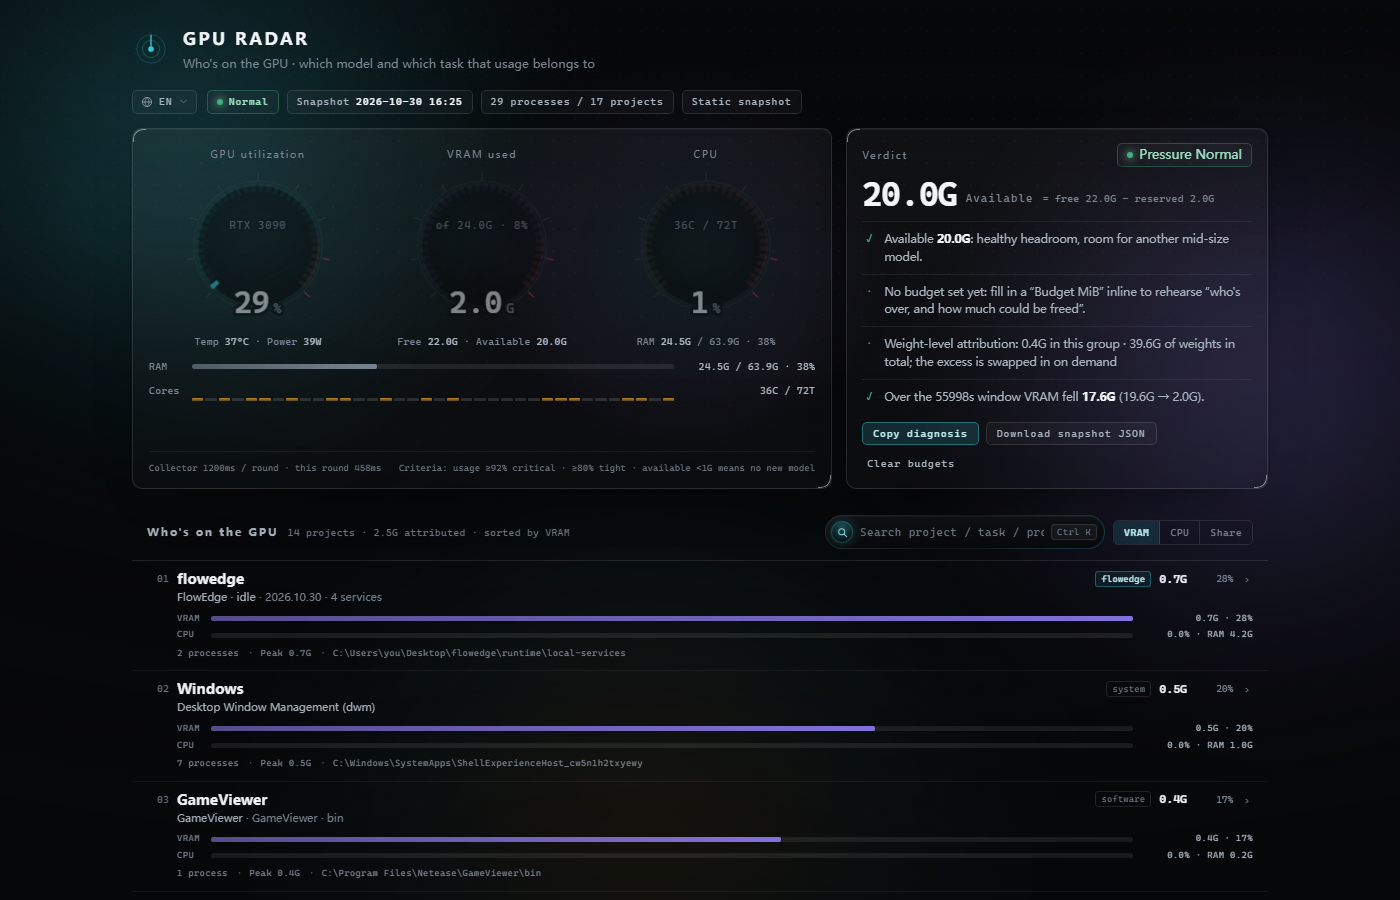
Shot from the standalone web build of the same panel; as a plugin it renders as a popover next to the input box.
Features
- Three dials — GPU utilisation, VRAM in use, CPU utilisation — each with a 0–100% mini trend line underneath
- RAM bar plus one load column per core
- Project leaderboard sorted by VRAM; two bars per row (VRAM and CPU), sortable by CPU or RAM
- Project detail: member processes with VRAM / CPU / RAM / peak, a runtime overview, loaded models, running jobs
- Process control: pause, resume, kill — for one process or the whole project
- VRAM budgets: cap a project, over-budget rows go red; reserved headroom with a one-click suggested value
- Follows the host theme, light and dark
- Bilingual panel: English unless the active DSH locale is Chinese
Install
Add one mount block to ~/.dsh/profiles/desktop/cordis.patch.yml:
- insert:
    - id: gpu-governor
      name: "file:///C:/Users/<you>/.dsh/plugins/dsh-gpu-governor/lib/index.js"
      config:
        intervalMs: 4000
Copy this repository to ~/.dsh/plugins/dsh-gpu-governor/ first. Editing lib/client.js only needs a page refresh; changing lib/index.js or lib/*.ps1 needs a client restart.
Use
The badge shows the busiest reading at a glance. The refresh button pulls a sample manually; the panel otherwise samples every 4 seconds. Kill requires a second click on the same button. Esc walks back out of the detail view.
| Question | Where the answer is |
|---|---|
| How much GPU / CPU / RAM is in use? | The three dials and the RAM bar |
| Who is holding VRAM? | Leaderboard rows are projects, not PIDs |
| Is it also burning CPU? | Two bars per row: VRAM and CPU |
| Which processes belong to this project? | Click a row: PID, VRAM, CPU, RAM, pause / kill |
| Which model or job is it actually running? | Detail view: runtime overview, loaded models, running jobs |
| How much can I still allocate? | Dial footnote: allocatable = free VRAM − reserved headroom |
| How did it get here? | The scope trace: last 10 minutes of VRAM (solid) and CPU (dashed) |
Where the numbers come from
Under WDDM, per-process VRAM from nvidia-smi is always [N/A], so per-process figures come from the driver performance counters instead.
| Metric | Source |
|---|---|
| Per-process VRAM | Win32_PerfFormattedData_GPUPerformanceCounters_GPUProcessMemory |
| Per-process GPU utilisation | The matching ...GPUEngine class |
| Card-level VRAM, temperature, power | nvidia-smi --query-gpu |
| Per-process CPU and RAM | Win32_Process, delta of KernelModeTime and UserModeTime |
| Process product name | The exe's PE resource FileDescription, cached by path |
| Machine and per-core CPU | Win32_PerfFormattedData_PerfOS_Processor |
| RAM | Win32_OperatingSystem |
The collector is a resident PowerShell child process (lib/collector.ps1) that prints one JSON line per round. Fields the host does not recognise are ignored, so the two halves can be updated independently. One round takes a few hundred milliseconds to about a second, every 4 seconds by default.
Project grouping
Command lines carry evidence of different strength, so they are bucketed first and the rules run in bucket order:
| Bucket | Example | Meaning |
|---|---|---|
script |
D:\AI\ComfyUI\main.py, ArenaDemo.uproject |
What is running — the strongest evidence |
binary |
...\Programs\Python311\python.exe |
The interpreter or program, i.e. only which software is in use |
arg |
--user-data-dir=...\Roaming\@deepseek-ai |
A directory in the arguments — the weakest evidence |
Rule order: workspace → desktop → path (AI, Projects, UEProjects, models, …) → software → drive root → exe → system. So python.exe D:\AI\ComfyUI-H3\main.py becomes ComfyUI-H3, and UnrealEditor-Cmd.exe ...\ArenaDemo.uproject becomes ArenaDemo.
Task identification
A python.exe says nothing on its own, so every process is turned into one sentence describing what it is doing:
| Situation | Shown as |
|---|---|
python.exe D:\AI\ComfyUI\main.py --port 8189, queue holds h3_t2v_fp8 |
ComfyUI-H3 · h3_t2v_fp8.safetensors |
llama-server.exe --model ...\blobs\sha256-..., Ollama holds qwen2.5:14b |
Ollama · qwen2.5:14b |
FlowEdge.exe with a running engine run |
FlowEdge · text-to-video #338 |
DSH NEXT.exe --type=gpu-process |
DSH NEXT · GPU process |
UnrealEditor-Cmd.exe ArenaDemo.uproject -game |
UE · ArenaDemo |
tts_breeze_server.py / asr_server.py |
TTS · breeze / ASR · faster-whisper |
dwm.exe / csrss.exe / explorer.exe |
Desktop Window Manager (dwm) / session manager / Explorer |
node.exe server.mjs --port 3000 |
node · server (second line: port=3000) |
Order: running FlowEdge run → resident LLM weights → ComfyUI weights → browser child role → local service script name → UE / Blender → system process role → interpreter plus script name → exe name plus install directory. When nothing can be probed it falls back to script name plus arguments, never a bare exe.
Runtime overview
Numbers alone do not say what something is, so after each sample the host makes bounded local probes and attaches the result to the project. A closed port or a timeout only costs detail, never the resource numbers.
| Source | Endpoint | Gives |
|---|---|---|
| FlowEdge | 127.0.0.1:8080/api/health, /api/deps, /api/runs?status=running, /api/pipelines |
Engine version and uptime, dependency services, running runs |
| ComfyUI | Dependency endpoint plus /queue, /system_stats, /history |
Queue, device VRAM, weights used by the last execution |
| Weight files | <install>/models/** and directories from extra_model_paths.yaml |
On-disk size per weight file |
| Ollama | 127.0.0.1:11434/api/ps |
Resident model names, VRAM and size |
ComfyUI attribution stacks three layers of evidence: ckpt_name, unet_name, vae_name and lora_name from prompts in /queue; otherwise the latest entry of /history, ordered by the timestamps in status.messages, because ComfyUI does not unload weights on its own; sizes are stat'ed per model root and cached. When the weight total exceeds resident VRAM the panel says the remainder is swapped in on demand instead of inventing an active/resident split.
Bases can be overridden with flowedgeBaseUrl, ollamaBaseUrl, or the FLOWEDGE_BASE_URL and OLLAMA_BASE_URL environment variables. probeServices: false turns probing off entirely.
Process control
| Action | Effect on VRAM | Effect on compute | Implementation |
|---|---|---|---|
| Pause | Not released, still held | Frozen | NtSuspendProcess |
| Resume | — | Unfrozen | NtResumeProcess |
| Kill | Released | Terminated | taskkill /F /T, children included |
Actions apply to one process or to a whole project, executed member by member with success and failure counts returned. Safety rules: only PIDs present in the current snapshot are accepted, PIDs at or below 8 are refused, DSH's own processes are refused, and every action appends one line to the audit trail. Pausing or killing other users' processes needs DSH running as administrator; otherwise the action reports access denied.
VRAM budgets
Windows has no per-process VRAM quota, so this is a soft budget plus a balance view. Set budgetMiB on a project: the row turns red past it and the bar draws the budget tick. The header's "allocatable" is free VRAM minus the reserved headroom reservedMiB. The suggested reserve is 6% of the card, clamped to 512MiB–4G; a "use suggested" button appears when the current value differs by more than 256MiB. Snapshots also carry pressure (ok, warn, crit at 80% and 92%) and overBudgetCount, persisted in state.json across restarts. Nothing is blocked and nothing is killed automatically.
State lives in ~/.dsh/gpu-governor/state.json (budgets and reserve); the audit trail is ~/.dsh/gpu-governor/audit.jsonl, one line per control action, rotated past 512KB.
Standalone web panel
vram-radar-wb/ is the same idea as a dependency-free web page that runs without the DSH host — useful for screenshots, sharing a snapshot, or checking a machine where DSH is not installed. See vram-radar-wb/README.md.
Layout
lib/index.js        host half: collector process, snapshot assembly, control actions, budgets, probes
lib/client.js       browser half: badge and React panel
lib/collector.ps1   resident sampler, one JSON line per round
lib/manage.ps1      suspend / resume helper
vram-radar-wb/      standalone web panel (engine + static page + optional skill)
License
MIT
No comments yet. Be the first to write one.