Workload Report for DSH
See your effort and your token spend on the same picture — by date and by workspace: a calendar heatmap, time-of-day analysis, workspace share, model usage, and per-KPI sparklines that follow the date range. A DeepSeek Harness (DSH) plugin. Current version: 2.6.0.


中文 · 日本語 · Deutsch · Français · Español · Русский · Português · English
What it is
DSH shows stats for the current session. This plugin adds the cross-session, cross-project, cross-time view: which dates and which workspaces your effort went to, which hours you were productive, which models consumed the tokens, and what it cost — plus a screenshot-friendly dashboard for clients, teammates or monthly reviews.
Not only cost, but the work behind it. Active time, active days and turns show what you actually did; tokens and estimated cost show what it consumed. Numbers use the same definitions everywhere, so every view agrees.
Who it is for
- Freelancers and studios who need to show a client where the time went — instead of saying "I was busy".
- Developers using several models who want active time, tokens, speed and estimated cost in one place, per date and per workspace.
- Anyone preparing a monthly or project review who wants the effort, tokens and trends in one screen instead of a spreadsheet.
- Multi-machine setups: merge usage from your laptop and desktop with the optional device sync.
Install & entry point
# npm (published package)
dsh plugin add dsh-workload-report

# or straight from GitHub (pin a release tag)
dsh plugin --profile web add github:tableau-China/dsh-workload-report#v2.0.0

# or link a local checkout (development)
dsh plugin --profile web add link:$PWD
DSH Desktop: open Settings → Plugins, search for dsh-workload-report, and install it there — no command line needed. For dsh web, run the command above and restart the Web profile.
The entry appears at the bottom of the sidebar: Workload report — its label follows the DSH interface language (8 languages, see Languages). The built client bundle (lib/client.js) is committed, so installing from GitHub/npm needs no local build.
Uninstall: dsh plugin --profile web remove dsh-workload-report.
Languages
The plugin has no language setting of its own: the dashboard, the AI-profile card (local fallback rules and model output), the sync dialogs and their server-side error messages all follow the DSH interface language (Settings → General → Language) and switch live.
| Language | Locale id | Dashboard | AI profile | Sync dialogs |
|---|---|---|---|---|
| English | en |
✓ | ✓ | ✓ |
| 中文(简体) | zh |
✓ | ✓ | ✓ |
| 日本語 | ja |
✓ | ✓ | ✓ |
| Español | es |
✓ | ✓ | ✓ |
| Français | fr |
✓ | ✓ | ✓ |
| Deutsch | de |
✓ | ✓ | ✓ |
| Русский | ru |
✓ | ✓ | ✓ |
| Português (Brasil) | pt |
✓ | ✓ | ✓ |
- Single source of truth: every user-visible string lives in
src/locales/<lang>.json;zh.jsonis the key baseline anden.jsonis the fallback.npm run check:i18nenforces identical key sets, key order and{placeholders}across all 8 languages, plus "no hard-coded copy in source" and "no dead keys". - AI profile: the model is explicitly asked to write the headline / dimensions / advice / risk in the active language; the deterministic local fallback uses the same dictionaries.
- Sync / server messages: user-visible results and errors carry a stable code + params; the client renders them from the dictionaries, so no raw server-side Chinese leaks into another language.
- Adding a language: copy
en.json, translate, register it insrc/locales/index.js— full workflow in docs/i18n.md, terminology in docs/i18n-glossary.md. On DSH versions without the locale service (pre-0.2.2), onlyzh/enare selectable and the plugin keeps working.
Data sources & principles
- Official interfaces only. Session identity comes from
sessionQuery.listSessions(); statistics come from the official projections (sessionProjections,sessionProjectionCache) and, when needed, the officialsessionQuery.observeSession()cold read. Model and hourly-token dimensions use the officialsessionQuery.readSession()event log. - No storage-format parsing. The plugin never opens
*.jsonl.zstd, never parses zstd/JSONL, and never reads the harness's internal projection-cache files. Formats can change between releases; the official seams are the contract. - Zero outbound requests by default. All statistics stay on your machine. The plugin exposes read-only HTTP routes only, and writes only its own local index at
<DSH_HOME>/workload-report/index-v9.jsonplus the AI-profile cache in the same directory (both safe to delete; they rebuild). The AI profile calls a model only after you click Generate. - Outbound-network cases: the optional balance chip (
balance.enabled: true, off by default), where the host calls the officialdeepseekAccountservice, and the AI user profile (included by default, but only a manual click calls the model; aggregate statistics only). See Privacy. - No invented numbers. Unreadable legacy sessions are excluded and counted in the UI; models without an official price show — instead of a made-up cost.
Features
- Eight KPIs (4 columns × 2 rows, all equal width): cumulative active time (net active, waiting shown on a second line), total tokens (full integer you can verify), model-time share, steps per turn (
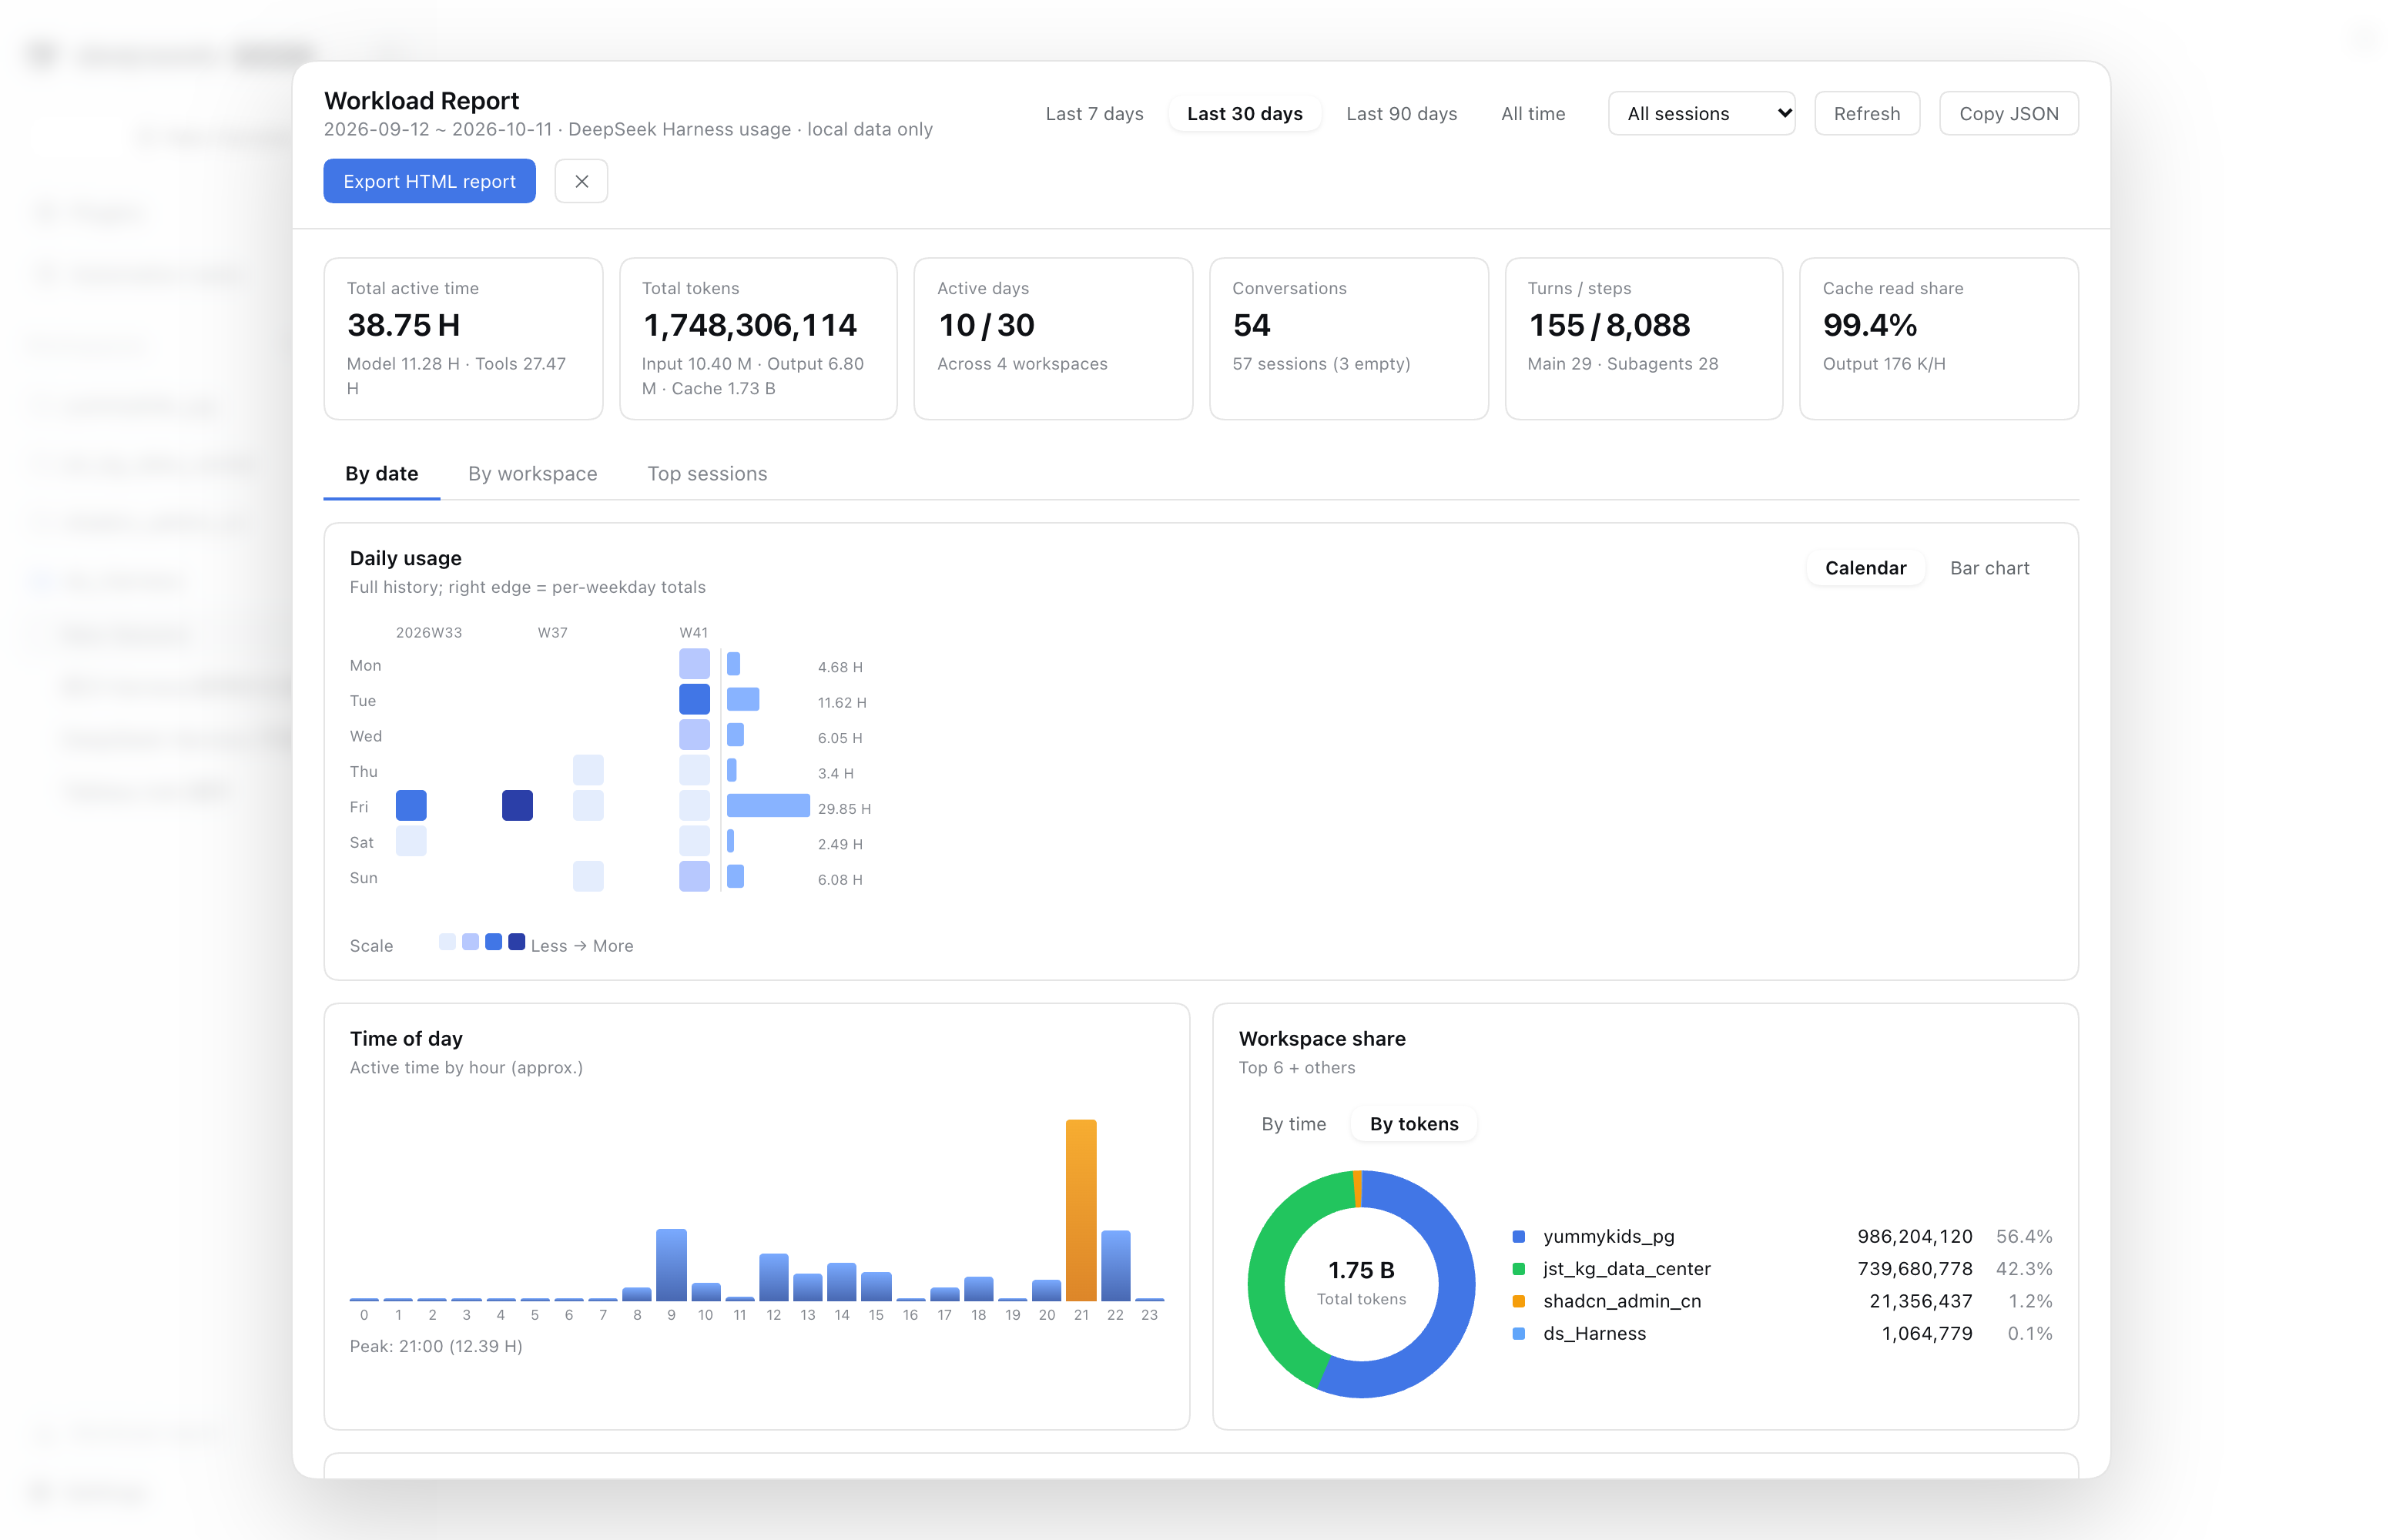
steps / turns— how many steps the AI runs per human turn), conversations / turns (one merged card, steps no longer shown), average output per request, output speed tok/s (subtitle = TTFT), and cache-read share. Each card carries a sparkline of its daily values over the selected range (7 / 30 / 90 days / all time); see docs/metrics.md. - Daily usage trend: calendar heatmap (Mon–Sun × Year-Week, colour and bar height = active time) or a bar chart; weekends use a different colour, the peak bar is always labelled, and every calendar cell, bar, weekday total and axis label has its own tooltip.
- Time of day: bars default to token output (switchable to turns); the dots above the bars show human-message density. Peak bars are highlighted and labelled; the legend sits on one row.
- Workspace share: Top 6 + others donut, switchable between time and tokens.
- Model token share: a compact donut on the dashboard; full model details live in the next tab.
- Model usage tab: treemap (area = token share, Top 8 + others), stacked daily trend (Top 6 models), a detail table (speed tok/s / TTFT / provider / share / requests / input / output / cache read / cache-hit rate / estimated cost — 11 columns, with ratio bars on speed and requests), metric chips (Token / requests / model time), click-to-filter, and official pricing links. Costs are estimated only for models with official public prices (
deepseek-v4-flash/deepseek-v4.1-flash/deepseek-v4-pro/deepseek-v4.1-proshare the official DeepSeek price, plus the-sgregional alias; other channel models show—). - Top sessions and daily detail: ratio bars in the main numeric columns (sessions: turns / steps / active / output; daily detail: conversations / turns / active / tokens) and sortable headers on the sessions table. The daily detail table is expanded by default, covers the last 31 days, and paginates at 10 days per page (no pager unless there is more than one page).
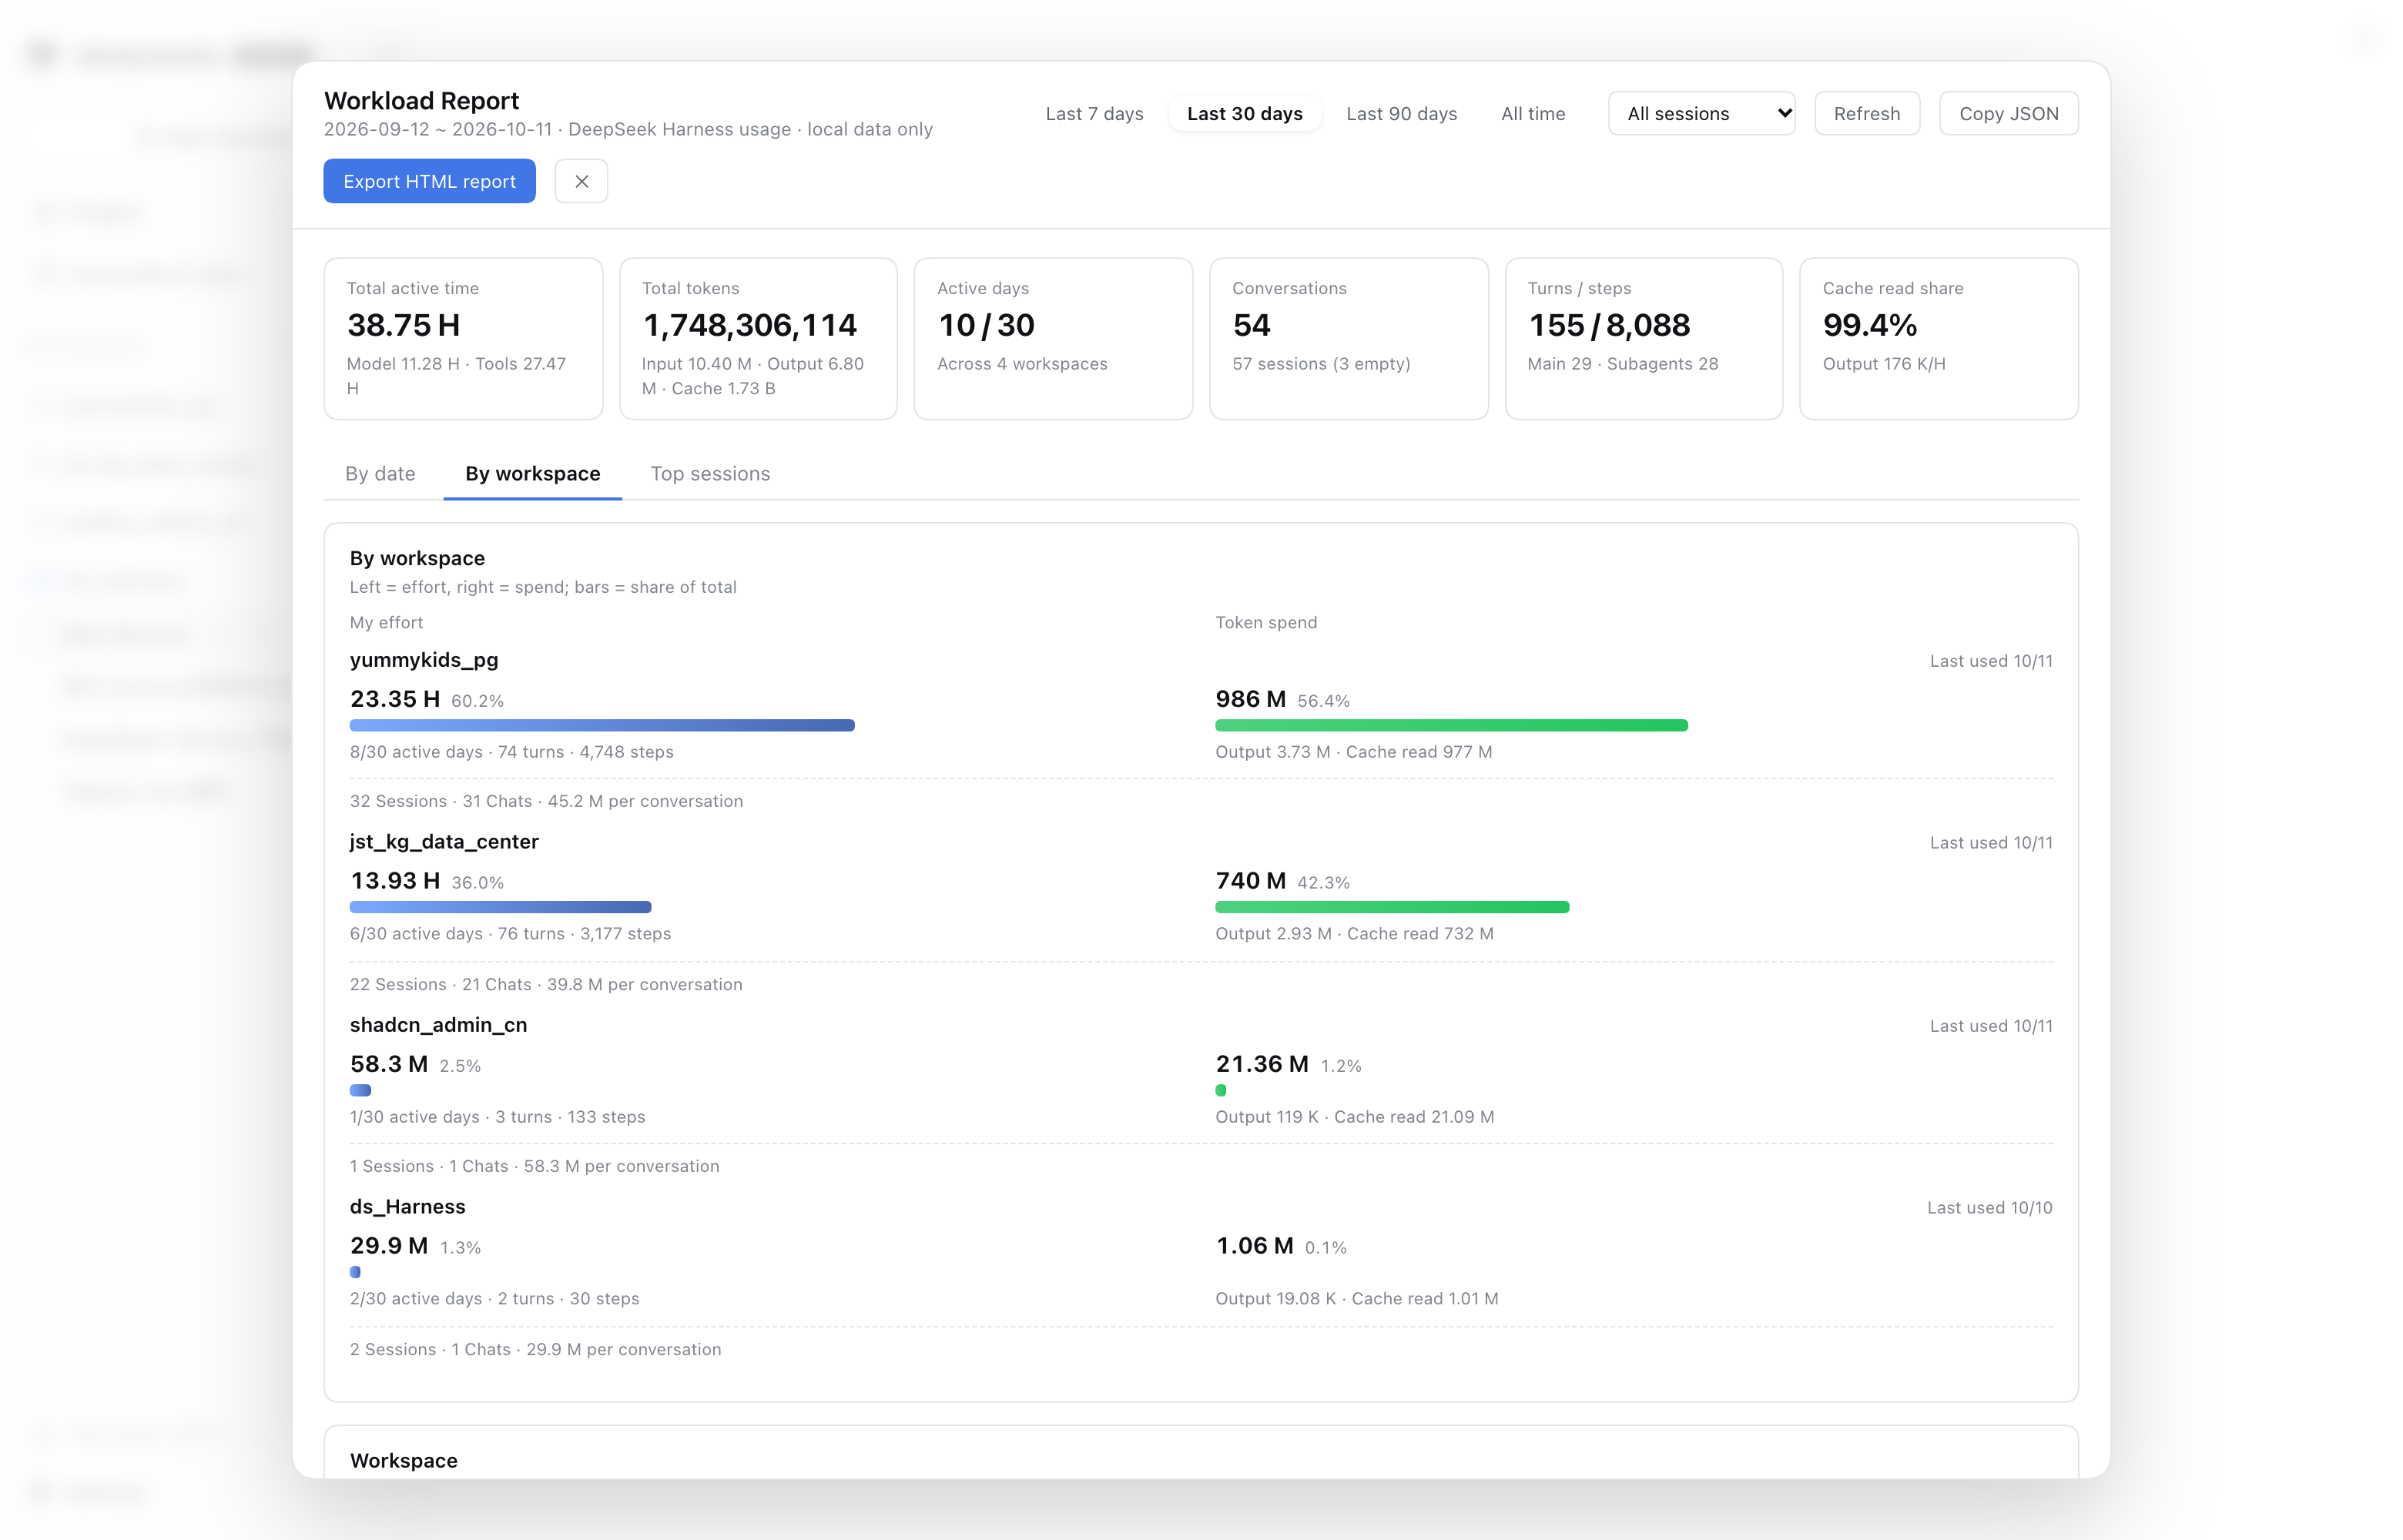
- By workspace: three bars per row — sessions / turns · my effort · token spend (one shared scale); the workspace list carries its own card head with a one-line hint (same structure as the model-usage page).
- Shareable snapshot (planned). The HTML report and its toolbar button were removed in 2.6.0; a single-page PNG snapshot for sharing is the planned replacement. Everything the dashboard shows stays on your machine.
- GitHub Star entry: "GitHub logo + ★ Star" in the top-right of the panel, opening the repo in a new tab. It stays inside the panel (no snapshot / export carries it).
- Theme and locale aware: data visualisation uses the Tableau 10 palette (
src/palette.js); UI chrome (buttons / tabs / links) keeps host theme tokens (--dsw-*) so it follows the harness light/dark theme. The dashboard, AI profile and sync dialogs are localised into all 8 languages shipped by DSH 0.2.2 (English, Chinese, Japanese, Spanish, French, German, Russian, Brazilian Portuguese) and follow the host language live — see Languages. - AI user profile (included by default, manual trigger): a dedicated top-level tab at the right end of the navigation (blue-tinted, distinct from the other tabs); the Top sessions tab keeps its sessions table only. It shows a three-line notice first and calls the model only after you click Generate. It generates a headline + 4–6 numeric dimensions + 2–3 advice items + risk from aggregate statistics only (window = max(current range, 30 days)) — never conversations, titles, or paths. The same statistics fingerprint reuses the disk cache; any failure falls back to deterministic local rules. See AI user profile.
- Fast open: opening the panel triggers zero event-log reads (
readSession); cold open 25 ms, warm open ~1 ms (measured on an isolated instance). Model folding is driven by background timers, never by opening the panel.
What's new in 2.6.0
- Eight KPIs, all equal width. The 9-card layout is gone:
kpi.topModel(a category, no numeric trend) andkpi.activeDays(a monotonically increasing cumulative line) are replaced by Steps per turn (steps / turns— how many steps the AI runs per human turn). The grid is now 4 columns × 2 rows with no spanning cards. - Sparklines follow the date filter. Every KPI card has a daily trend line built from
snapshot.byDay, so choosing 7 / 30 / 90 days or All time changes both the value and the sparkline. No sampling, no aggregation, no invented points: days without data break the line instead of drawing a fake zero. The geometry (src/sparkline.js) and series (src/kpi-series.js) are single-source, so every card uses the same rules. The sparkline sits to the right of the label and value and the subtitle spans the card bottom, so cards stay compact (≈100 px instead of ≈150 px); the range / point count lives in the SVG tooltip rather than a separate line. - The HTML report is gone. The
Export HTML reportbutton and the whole report feature (/report.htmlroute, renderer, 34 dictionary keys) were removed: real clicks landed on a host overlay (_mask_*) rather than the button, and bothwindow.openand<a target="_blank">were tried. A single-page PNG snapshot is the planned replacement. - Active days / streak moved to the calendar card. The "Daily usage trend" card now summarises the heatmap in its header: active days out of the full history, the current streak, and the longest streak in a tooltip — all-history scope, matching the chart instead of the selected range.
- Active days and the top model are still available elsewhere (workspace table / model tab); the KPI row just no longer spends two cards on them.
What's new in 2.5.2
- The HTML report export is back. The
Export HTML reportbutton had been hidden since 2.1.0 while the/report.htmlroute and renderer kept working; it was visible again in all 8 languages. (Removed again in 2.6.0 together with the whole HTML report feature.) - Exports followed the device filter and the report caught up with the dashboard (nine KPIs including output speed, no stale share subtitle, three workspace bars). (Both were removed together with the report in 2.6.0.)
What's new in 2.5.1
- V4.1 models are priced:
deepseek-v4.1-flash/deepseek-v4.1-prouse the same official DeepSeek price asdeepseek-v4-flash/deepseek-v4-pro(CNY + USD, peak/off-peak). Three-segment channel keys (magpie/workbuddy-ai/deepseek-v4.1-flash) and the-sgregional variant now resolve to a price too. Override any name withpricing.overrides. - Consistent model names: the same disambiguation is used by the trend legend, treemap, detail-table row titles and home donut — when a model reaches you through several routes, all of them show
model · providerinstead of only the legend doing so. - DeepSeek account vs API key:
deepseek-account(signed-in DeepSeek account) anddeepseek-official(your DeepSeek API key) are separate rows with readable, localised provider labels; the raw route id stays in the tooltip. The index was rebuilt once (v8 → v9) so historical sessions are re-folded with the new grouping. - Note: event logs contain the provider route only — never the credential itself. Custom gateways cannot be classified automatically.
What's new in 2.5.0
- Six new interface languages: Japanese, Spanish, French, German, Russian and Brazilian Portuguese — alongside English and Chinese. The dashboard, AI profile and sync dialogs all follow the DSH language live, with an English fallback for anything untranslated.
- One dictionary source: UI copy moved from a single JS file with two languages to per-language JSON dictionaries (
src/locales/*.json, 398 keys) shared by the browser half and the Node half.npm run check:i18nguards key-set / key-order / placeholder parity. - AI profile follows the language: the model is told to write in the active language, and the deterministic local fallback rules are fully translated (whole-sentence templates with
{placeholders}instead of string concatenation). - No Chinese server-side leaks: sync / settings / credential results now return a stable
code+params; the client renders them from the dictionaries (falling back to the server message only for unknown codes). - Data layer is language-neutral: unknown workspace / model / provider / session-title labels are no longer baked into the API payloads — each surface renders its localised placeholder.
What's new in 2.4.0
- Correct device filtering: select a device and every chart shows only that device (local included), not just the calendar.
- Pulled data survives restarts: the last pull is cached to disk, so other devices stay visible after a restart or offline.
- Auto fallback: a device that disappears from the sync sources is dropped from the filter (back to "all devices" if none remain).
- Donut fixes: colours now switch correctly and the legend no longer accumulates even when models share a name.
- Short provider names (
workbuddy-ai/auto/workbuddy) with the full path in the tooltip. - Refresh really refreshes (bypasses the host cache); ESC now goes to the sync dialog instead of closing the panel.
Screenshots
By date: eight KPIs with sparklines + calendar heatmap + time-of-day analysis with human-message density dots + workspace share
By workspace: three bars — sessions / turns · my effort · token spend, one shared scale
Metric definitions
The full definitions live in docs/metrics.md. Durations use one language-neutral H / M / S format (like K/M/B for tokens).
- Active time = model time + tool time − waiting for user. It is cumulative engine work, not wall-clock time (concurrent sessions and subagents each add up). Waiting for user is tracked separately as
waitMs. - Time of day defaults to token output (switchable to turns), with human-message density dots on top. Sessions with unreadable event logs are excluded from the token chart and counted in the card.
- Total tokens = uncached input + output + cache read + cache write. Conversations = sessions with at least one step. Attribution date = the session's creation day in the selected time zone.
- Model cost is estimated from built-in official public prices; only models with an official price get a number, others show — (an estimate, never an invoice).
- Output speed tok/s = weighted
ΣdecodeTokens / (ΣdecodeMs / 1000), excluding time to first token. TTFT =step/start → first token. - Ranges: the end is always today and the start is
max(window start, first active day), so the active-days denominator is always the real span. The calendar heatmap always covers full history.
Configuration
Override any of these in the profile's cordis.patch.yml (all optional):
- id: workload-report
  name: dsh-workload-report
  config:
    defaultDays: 7                 # initial range: 7 | 30 | 90 | all
    refreshMs: 30000               # index refresh interval (ms)
    snapshotCacheMs: 15000         # snapshot cache per query (invalidated by events/index/fold)
    modelFoldWarmupMs: 2000        # warm-up fold after the index is ready (never from opening the panel)
    modelFoldIntervalMs: 720000    # periodic fold maintenance (12 min)
    modelFoldIdleMs: 600000        # only refold a live session after 10 min without events
    modelRetryMs: 1800000          # retry failed rows after 30 min (never changes the status line)
    revalidateMs: 604800000        # index row TTL: re-validate after this long (default 7 days)
    revalidateRecentDays: 30       # only re-validate sessions active in the last N days; 0 = disable the optimization
    snapshotSwr: true               # after a live event, serve the previous snapshot and rebuild in background (false = old behaviour)
    snapshotStaleMaxMs: 600000      # max age of a snapshot served by SWR (default 10 min)
    defaultScope: all              # all | main | subagent
    modelUsage: auto               # auto | off (off = do not read event logs for model/hourly data)
    excludeWait: true              # false = keep 0.6.0 behaviour (no wait detection)
    waitTools:                     # tools treated as waiting for a human
      - ask_user_question
      - exit_plan_mode
    waitMinMs: 60000               # minimum interval to be treated as waiting (ms)
    activeModelMetric: requests    # requests | tokens | activeMs
    workspaceAliases:              # display names, useful in client reports
      my-shop-app: Retail Order System
    balance:                       # optional balance chip — OFF by default
      enabled: false               # true = host calls platform.deepseek.com (see Privacy)
      refreshMs: 300000            # balance cache TTL (ms)
    aiProfile:                     # AI user profile — included by default, manual trigger only
      enabled: true                # set false to hide the entry; opening the panel never calls a model
      provider: ""                 # empty = host agentDefaultModel selection
      model: ""                    # use together with provider
      timeoutMs: 60000             # AbortSignal.timeout(timeoutMs)
      minDays: 30                  # aggregate window floor (days): a 7-day board still profiles 30 days
      # deliberately no maxTokens: an output cap truncates the JSON; the plugin repairs it instead
      cacheTtlMs: 86400000         # fingerprint cache TTL (ms); 0 = no disk cache
The default model prices are built in and offline; pricing.overrides, pricing.asOf and pricing.links let you replace them if your contract differs. See docs/models.md.
Multi-device sync (2.0.0)
Running DSH on several machines? Merge their usage into one report. Disabled by default — with no sync config the plugin behaves exactly as before and makes zero outbound requests.
No YAML needed. Open the dashboard → Device sync (right end of the device-filter row) → one large dialog opens directly (the old sync page is merged into it, there is no second layer):
- Status icon next to the title:
✓configured and reachable,!configured but failing,○not configured / disabled / untested. - Device name at the top (global — set once, used by all four backends).
- Storage + enable switch: Tencent COS / GitHub / Gitea / shared folder.
- Connection details as "label on the left, input on the right", one field per row; credentials expanded by default.
- Connection & sync status: probe result, last push / pull, registered devices, last test.
- "Test connection" lives inside the dialog and saving runs a probe automatically, so the icon and status update immediately.
- Sync frequency: every 6 hours (default) / every 12 hours / on every boot / manual only — applied immediately on save (timers are rebuilt). With manual only, "Push now" / "Pull now" appear right after the options.
- One "Save settings" button writes the profile config, then the credentials, then probes once.
Prefer a config file (servers / CI)? That works too — see section 4 of docs/sync.md.
- id: workload-report
  name: dsh-workload-report
  config:
    sync:
      enabled: true
      transport: cos          # cos | github | gitea | local
      cos:
        bucket: my-sync-1250000000
        region: ap-guangzhou
        secretIdFile: ~/.dsh/.cos-id    # 0600
        secretKeyFile: ~/.dsh/.cos-key  # 0600
| Transport | Best for | Credential |
|---|---|---|
cos |
Tencent Cloud COS — low latency, near-zero cost | SecretId/SecretKey (sub-account scoped to machines/* of one bucket) |
github / gitea |
You already have a Git account | fine-grained PAT: Contents: Read and write, one repo only |
local |
No cloud account / corporate intranet | none — point at an iCloud / Syncthing / NAS folder |
- Aggregate rows only: per-session stats (id / time / path / duration / tokens / models). No conversation content, prompts, or attachments.
- Machine identity is automatic: read from
<DSH_HOME>/.anonymous-user-id; override the display name withsync.machineName. - Conflict-free by construction: each machine writes only its own key (
machines/{machineId}.json). - Per-device filtering: device chips above the KPIs, or
?machine=on the API. - Built-in "Device sync" entry at the right end of the device-filter chip row (not a top tab); it opens sync settings, credentials, device status and manual push/pull.
- Use a private bucket/repo: the payload carries absolute
cwdpaths. The UI no longer offers the "redact paths" toggle (its meaning was unclear and it was already off by default); if you need it, setsync.redactPaths: truein the config to hash them.
See docs/sync.md for the full config reference and least-privilege policies.
Version
The dashboard appends its version and build hash to the definitions note at the bottom:
Definitions: metric definitions in docs/metrics.md; all data stays local. · v2.4.0 · 9eadcd8
                                                                          └─ host commit hash
- The version comes from
package.jsonvia the host (/sync); it is never hard-coded in the client and is not rendered when unavailable. - The build hash identifies which build the page is running: if it stays old after an upgrade, the browser cached the client bundle (restart DSH / hard refresh) — it does not mean the version bump was forgotten.
- It is plain selectable text, so you can paste that line in a bug report.
- Release-time check:
node test/check-release.mjs --tag vX.Y.Zcomparespackage.json, CHANGELOG and both READMEs and validates the tag; it runs in CI.
Style and layout changes (2.0.0)
- Equal initial height for all four tabs: the panel is a fixed
92vhframe and scrolls internally, so switching between By date / Model usage / By workspace / Top sessions no longer jumps the frame height. - Responsive panel width: full width on narrow screens, capped at 1450px on wide ones, with viewport-scaled side padding (it used to be a fixed 1120px, leaving large empty margins on big displays).
- "Device sync" entry now sits at the right end of the device-filter chip row instead of the top tab bar.
- One shared range rule: 7 / 30 / 90 days and All time all start at the first active day; a short history
shows its real span (for example
5/5 daysinstead of5/30).
AI user profile
Included by default, but only generated by a manual click; opening the panel never calls a model. The profile lives on its own top-level tab, aligned to the right end of the navigation and tinted so it stands out from the other tabs; the Top sessions tab keeps the sessions table alone.
- First-open notice: before any result, a three-line panel explains that only the last N days of aggregates are sent (no conversation text / titles / paths), which provider/model will be used (host default when unknown), and that the model is called — and costs may apply — only after clicking Generate profile. The notice disappears once a result exists; the result card offers Regenerate.
- Trigger: opening the panel only runs a
probe(no model call;llm.prepareCallstays at 0). The model is called when you click Generate profile / Regenerate; the button is disabled while generating. - Aggregate window: the request always uses
max(current range, aiProfile.minDays);minDaysdefaults to 30, so a 7-day board still produces adays >= 30payload. The result card says “Based on the last N days”, where N is the actual window. - What is sent: a strict whitelist of 56 aggregate fields — range, net active / wait time, sessions and turns, the four token components and their shares, cache-hit rate, average session / turns / steps, four session-duration buckets, 24 hourly token buckets, five time bands (active + token shares), top 5 workspaces, top 5 models, workspace count / switches, model count / multi-model, weekend / night share, and a last-7-days vs previous-7-days trend. Never conversation content, session titles, cwd, paths, session ids, or event logs. The host asserts the key set is exactly the whitelist and recursively rejects private keys and path-like strings.
- Prompt: senior productivity analyst; every insight must cite a number, and generic advice is forbidden. The reply must be strict JSON (
headline / dimensions / advice / risk),temperature: 0.35; nomaxTokensis sent. - Parsing / truncation rescue: clean JSON → code fence → lenient first-
{-to-last-}extraction. Whenfinish.kind=lengthor the text is clearly unfinished, the plugin closes unclosed strings / arrays / objects and parses again; success is markedtruncated: true(card footer says “Output truncated; repaired and used”). Only an unrepairable result falls back, with the first 300 characters indiagnostic.excerpt. - Cache: SHA-256 (first 16 hex chars) of the stable JSON of that whitelist (new fields participate automatically). The result is cached on disk next to the index (atomic
tmp→rename,PROFILE_CACHE_VERSION = 4); an identical fingerprint returns the cache without another model call.force=1regenerates. - Failure = local rules: missing
llmservice, not signed in / no models, timeout, empty output, or unparsable JSON all fall back to a deterministic local rules profile with the same shape (headline + 4–6 dimensions + 2–3 advice + risk, every insight still numeric, no network). A non-stopfinish whose JSON can be repaired is used instead (truncated: true); only an unrepairable one falls back. The response always carriessource: "llm" | "local"and a stablecode; nothing is thrown to the UI. - Diagnosable: failures also carry
diagnostic.error.{code,message,stage}(the underlying error code is preserved; the message is redacted and capped at 300 characters) plusroute/precheck;/healthexposesdiagnostics.aiProfilewith the latest attempt. For debugging,provider=/model=query parameters override just that request (only whenenabled=true; no config write, no cache write, no restart). - Not counted in this report: the profile call is an auxiliary call outside any session, so it is not included in this plugin's token / cost report. The card shows that call's input/output tokens and generation time separately.
Full details: docs/ai-profile.md.
Read-only API
| Route | Description |
|---|---|
GET {apiPath}/snapshot?days=30&tz=Asia/Shanghai&scope=all |
Aggregated snapshot JSON (totals / byDay / byWorkspace / byHour / bySession / calendar / byModel / modelDaily / diagnostics) |
GET {apiPath}/export.json?... |
Same payload with a content-disposition header |
GET {apiPath}/profile?days=30&tz=...&lang=zh&probe=1 |
AI user profile: probe=1 only reports enabled / signed-in / model, never calls one; otherwise generates on demand; days is floored at aiProfile.minDays (30); force=1 bypasses the fingerprint cache |
GET {apiPath}/profile?...&provider=...&model=... |
Debug entry: override the route for this request only (only when enabled; no config write, no cache write) |
GET {apiPath}/health |
Index diagnostics (sessions, checkpoint hits, cold reads, read failures, duration); diagnostics.aiProfile has the latest profile code / stage / error / route |
GET {apiPath}/balance |
Cached balance state for the toolbar chip; never touches the index |
Parameters: from/to (YYYY-MM-DD, take precedence over days), days, all=1 (earliest active day → today), tz (IANA time zone), scope, machine (repeatable device id — same filter as the dashboard).
Index & upgrading
- Index file:
<DSH_HOME>/workload-report/index-v9.json;INDEX_VERSION = 9. - Upgrading from 0.6.5 or earlier rebuilds the index and re-folds event data on first launch (the hour buckets and hourly token/human-message fields are versioned). The API returns progressively filled data with
indexing: truewhile this runs. - Deleting the index is safe: the plugin cold-reads historical sessions again. Cold reads use official interfaces and concurrency 8 (about 2 minutes for 300+ sessions on the author's machine).
- Very early v0-format sessions may not be readable at all. They are excluded from statistics and the UI reports how many; the time-of-day card shows “Token 未计入 N 个会话” when their token distribution cannot be read.
FAQ
How do I see my total token usage across all DSH sessions?
Install the plugin, restart DSH, and open Workload report at the bottom of the sidebar. The Total tokens KPI sums every session in the selected range (today / 7 / 30 / 90 days / all time); the daily table and the workspace and model tabs break it down. Unlike a per-session stats line, this view is cross-session, cross-project and cross-device.
How is this different from a token or cost dashboard?
Token and cost dashboards answer "how much did it consume?". This plugin answers "where did my effort go?" — it measures active time (model time + tool time, with waiting-for-user time excluded), attributes it to dates and workspaces, and puts it next to token usage. You can see a 46%-of-effort project, a 3.7 B-token month, and a review-ready dashboard — from the same data.
Can I send the report to a client or my manager?
Not as a file yet. The self-contained HTML report was removed in 2.6.0 (its toolbar button was already unreliable); a single-page PNG snapshot is the planned replacement. For now you can screen-share the dashboard or use your own screenshots.
Can I merge usage from several computers?
Yes, optionally. Device sync merges per-session aggregate rows from several machines through Tencent COS, GitHub, Gitea or a shared folder (iCloud / Syncthing / NAS). It is off by default and only syncs the numbers — no conversation content, titles, prompts or attachments. Each device writes its own file, so there is nothing to merge by hand.
Does the plugin send my data anywhere?
No, by default everything stays on your machine. The plugin registers read-only local HTTP routes, uses only official DSH interfaces, and writes only its own local index and cache. Two features can use the network and are opt-in: the balance chip (off by default) and the AI profile (only after you click Generate; it sends aggregate statistics only).
Which interface languages are supported?
The dashboard, the AI profile and the sync dialogs follow the DSH interface language and are localized into all 8 languages shipped with DSH 0.2.2: English, Chinese, Japanese, Spanish, French, German, Russian and Brazilian Portuguese. Switching the language in Settings → General → Language switches the plugin live — no reload, no plugin setting.
How do I install it in DSH Desktop or dsh web?
In DSH Desktop: Settings → Plugins → search dsh-workload-report → install. In dsh web: dsh plugin add dsh-workload-report, then restart the Web profile. You can also install from GitHub (dsh plugin --profile web add github:tableau-China/dsh-workload-report#main). The built client bundle is committed, so no local build is required.
Documentation
| Document | What it covers |
|---|---|
| docs/metrics.md | Definitions: active/net/wait, time-of-day, tokens, calendar, workspaces |
| docs/models.md | Model attribution, grouping, cache-hit rate, peak/off-peak pricing and cost estimation |
| docs/ui-conventions.md | Shared UI components, card heads, legend/status rules, tooltip rules |
| docs/ai-profile.md | AI user profile: whitelist payload, cache fingerprint, fallback codes, privacy |
| docs/discoverability.md | How this project is made discoverable: keywords, channels, submission checklists, launch plan |
| docs/i18n.md | 8-language architecture, maintenance rules, how to add a language |
| docs/i18n-glossary.md | Terminology and translation rules for translators |
| docs/preaggregation.md | Pre-aggregation assessment: measurements, costs, trigger conditions (verdict: not needed yet) |
| CHANGELOG.md | Version history and testing notes |
| PROGRESS.md | Decisions, measurements, environment gotchas and release notes |
Privacy
All statistics stay on your machine. The plugin registers read-only HTTP routes only: by default no outbound requests, no telemetry, no user content collected. It writes only its own index cache plus the optional AI-profile cache; nothing else in your harness data is touched.
Optional balance chip — off by default. Only when you set balance.enabled: true does the host call the official deepseekAccount service: getBalance() makes the host request https://platform.deepseek.com/api/v0/users/get_user_summary (the account balance endpoint). It is opt-in and cached for balance.refreshMs. The top-up/usage links come from the service's local getState() and need no network. A failed or timed-out query shows an em dash with a top-up link — never an error dialog. The balance is rendered only in your own toolbar chip.
AI user profile — included by default, manual trigger only. Opening the panel / probe only reads enabled, sign-in state, and provider/model; it never calls a model. Only after you click Generate profile does the plugin call the llm service (and your configured model provider) with the aggregate whitelist described in AI user profile, always using a window of at least 30 days. No conversation text, titles, paths, session ids, or event logs are sent. The response is cached on disk in the plugin's own directory; no report file is produced. If the service is missing, you are not signed in, the call times out, or parsing fails, the card falls back to local rules and shows the reason — no error dialog. This side call is not included in the plugin's token / cost report. Set aiProfile.enabled: false to hide the entry and guarantee zero model calls.
Development
| Command | Purpose |
|---|---|
pnpm add -D esbuild puppeteer-core |
Install build and browser-test dependencies (or point ESBUILD_PATH / WL_PUPPETEER_DIR at existing installs) |
node build.mjs |
Bundle src/client/ into lib/client.js (ModuleLoader factory format) with esbuild |
node test/verify.mjs |
1625 offline assertions: aggregation semantics with one shared range rule, time zones, turn-based hour bucketing and conservation, hourly tokens by message time, human-message density, wait exclusion (all three rules + long-task exemption + excludeWait:false regression), index/read fallbacks, the AI-profile tab as a right-aligned navigation entry, the 30-day profile window, multi-device sync (payload / merge / credentials / settings / device filter / pull-cache persistence), output-speed and TTFT definitions, KPI sparkline series / geometry / calendar summary, zero model calls on first open, i18n key alignment, balance states, and 8-language rendering (dashboard helpers / AI profile / prompt) |
./test/e2e-boot.sh 3299 |
Boot an isolated instance (own DSH_HOME and port) without touching your running GUI |
node test/i18n.mjs |
I18n dictionary checks (85 assertions): key sets / order / placeholders / empty values / untranslated / hard-coded copy / dead keys across all 8 languages; --lang de checks one language |
node test/e2e-ui.mjs |
Real-browser E2E: calendar/bar switching, geometry, donuts, KPI sparklines, time-of-day card |
node test/e2e-i18n.mjs |
Real-browser E2E in all 8 languages: injects navigator.languages, opens the panel, asserts copy against the dictionaries and saves screenshots |
CI runs build.mjs + verify.mjs, and fails if the committed lib/client.js differs from a fresh build.
Compatibility
- DSH
0.2.x, includingalphaprereleases (developed and verified against@deepseek-ai/dsh@0.2.1-alpha.2and0.2.2-rc.1). The manifest declaresengines.dsh >= 0.2.1-alpha.0with no upper bound, so upgrading DSH to a newer 0.x build does not exclude the plugin by version range; newer versions are allowed to load but only the versions above are explicitly verified. The plugin depends only on official interfaces (sessionProjections/sessionProjectionCache/sessionQuery) and Node built-ins, never on internal file formats. - The first launch cold-reads historical sessions whose projection checkpoints are missing; the API returns progressively filled data with
indexing: true, and restarts reuse the persisted index. - Very early v0-format sessions may not be migratable/readable by the current harness. They are excluded from statistics and the UI reports how many.
No comments yet. Be the first to write one.