TWb Viewer for DSH · Tableau Workbook Inspector
A delivery tool for Tableau consultants. Inspect a workbook (
.twb) inside DeepSeek Harness — no Tableau Desktop, no license, no data: a 1:1 SVG dashboard layout you can hand to a client as a whiteboard file, a table-level data model showing how the tables are joined, a field-level lineage graph, and the custom SQL behind each datasource. Everything is parsed in your browser; a DeepSeek Harness (DSH) plugin that reads metadata only and never touches your data.





中文 · English
What problem it solves
Workbooks are the hardest thing to explain about a Tableau deployment. You have a .twb file — from a client, a colleague, or your own archive — and you need to answer questions like:
- What is actually in this dashboard? Which worksheets sit where, how big are they, what is a container vs. a worksheet vs. a text zone.
- How do these calculated fields connect? Which field feeds which, what breaks if I change a formula, where a field's lineage starts and ends.
- How are the tables joined? A table-level data model: which table joins which, the ON condition, the join type, and the cardinality when Tableau records it.
- What SQL is behind this datasource? Every custom SQL (
<relation type='text'>) pulled out and listed, so you can confirm the query logic line by line instead of opening Tableau. - What is this workbook wired to? Server, database, file path, field roles and data types — without opening Tableau.
- How do I document it for a client? A layout you can export to Excalidraw/SVG and annotate, plus a lineage diagram you can walk through in a meeting.
Tableau Desktop shows you this by opening the workbook; DSH's plugin shows it in the browser, instantly, with no license and no data.
Features
- ✅ English & Chinese UI: the panel follows the DSH interface language (switch it in Settings → General → Language); dates, numbers and workbook data stay untouched.
- ✅ One click from the left sidebar: the plugin registers its own panel row in the DSH sidebar, so it opens as a full page next to your conversation — no digging through Settings.
- ✅ Open and it is already there: the plugin auto-loads a built-in sample workbook, so you see the whole UI in one second — then drop in your own
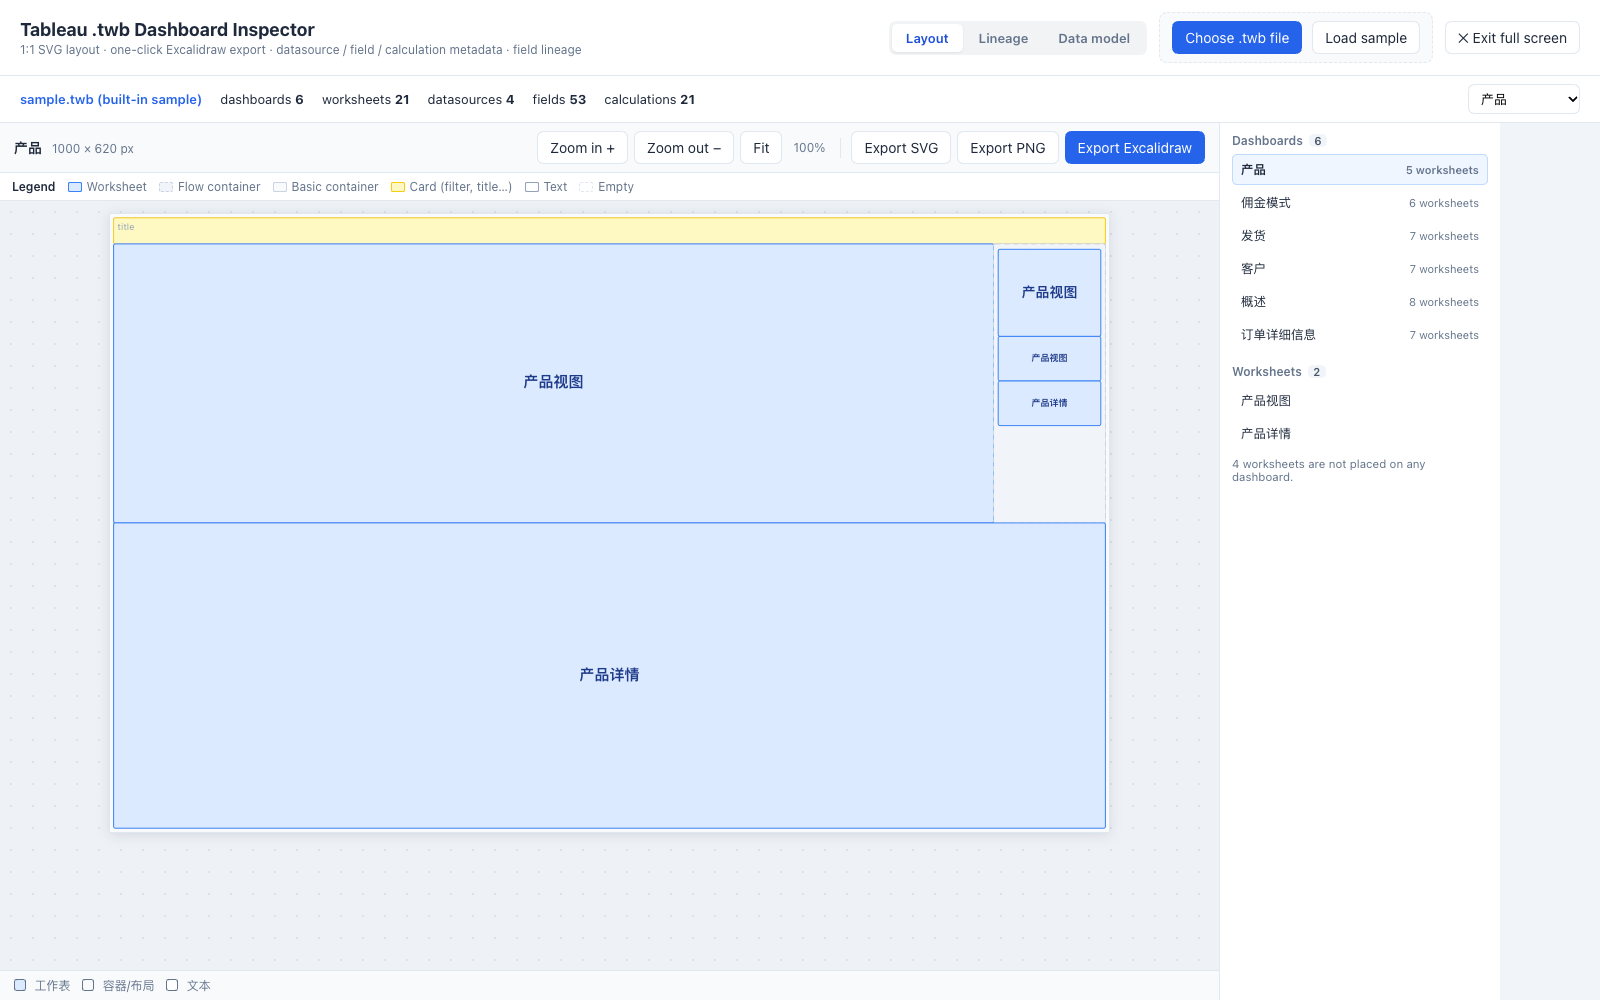
.twbto replace it. - ✅ 1:1 dashboard layout: every dashboard zone is drawn as SVG at true scale (worksheets, containers, text), with zoom / pan and one-click export to SVG / PNG / Excalidraw for annotated review decks.
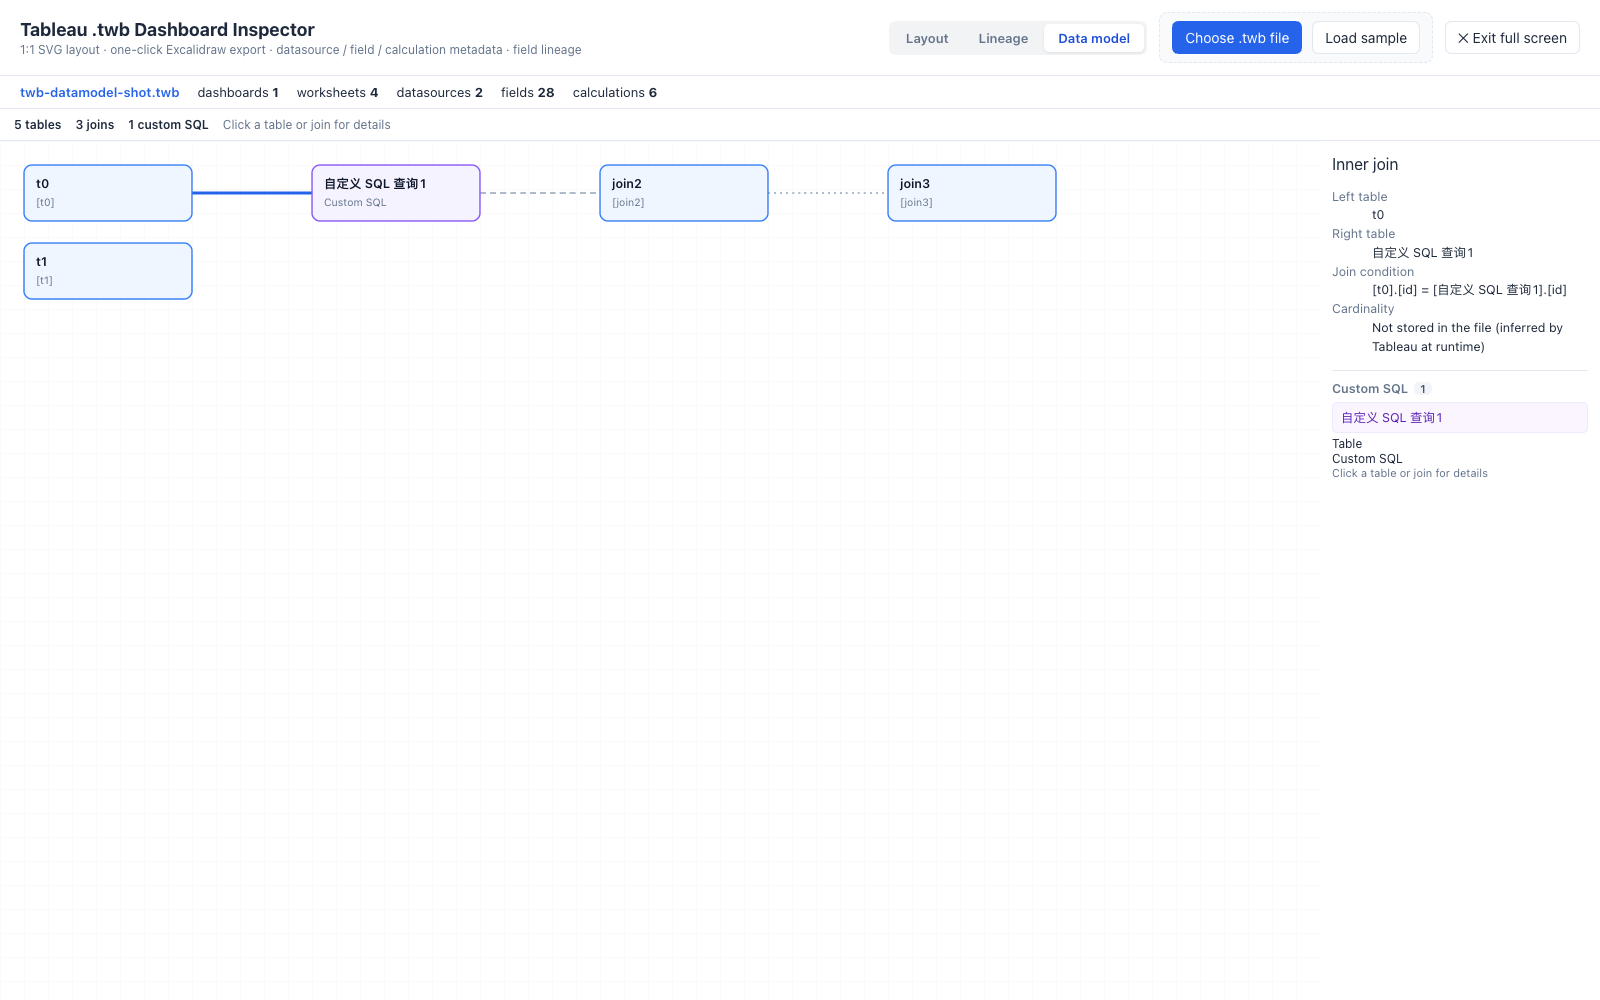
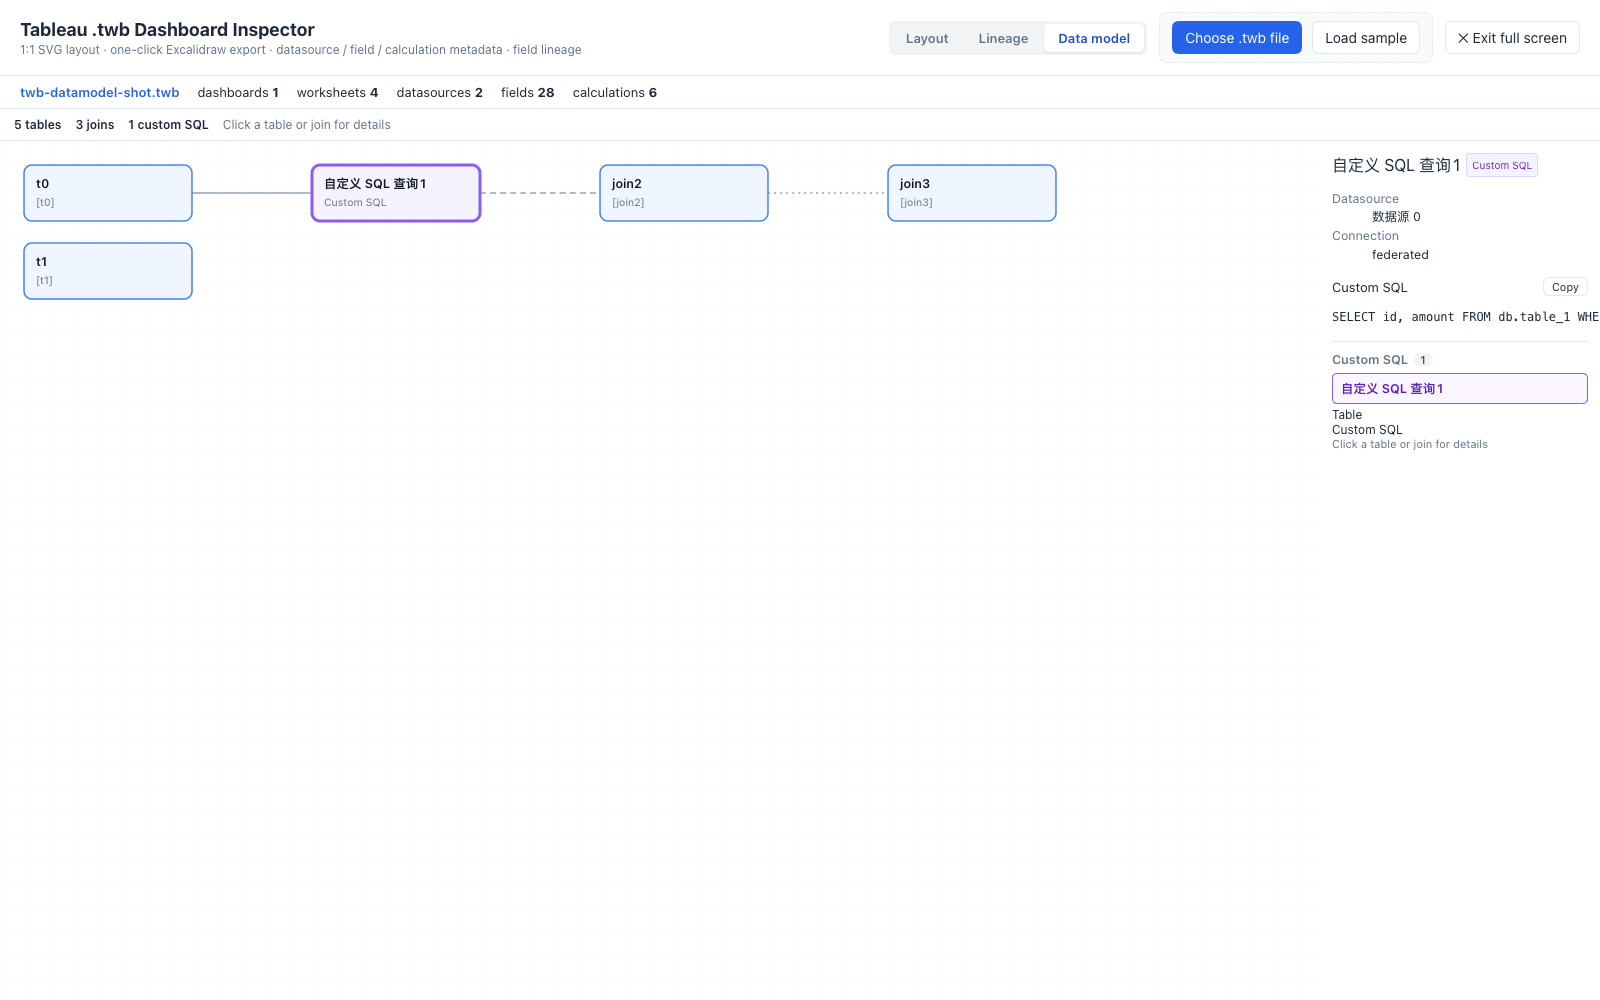
- ✅ Table-level data model: every datasource's relation tree is parsed into tables + joins — join type (inner/left/right/full), the ON expression, and cardinality when the file records it — drawn as an arc diagram (balanced curves, children centred on their parent) with a detail pane.
- ✅ Parameters, read properly: Tableau parameters get their own tab, with the current value formatted by the workbook's own number format (
p0.00%→6.40%,C2052→¥50,000) instead of the raw float64 stored in the file (0.064000000000000001); the raw value stays visible for verification. - ✅ Custom SQL inventory: each
<relation type='text'>is extracted, listed per datasource and copyable, so agreeing on the query logic takes one screen instead of a Tableau session. - ✅ Zone-level detail: zone subtypes (worksheet / flow container / basic container / card such as filters and titles / text / empty) are colour-coded with a legend, and hovering a zone shows its size, padding, margin and fill.
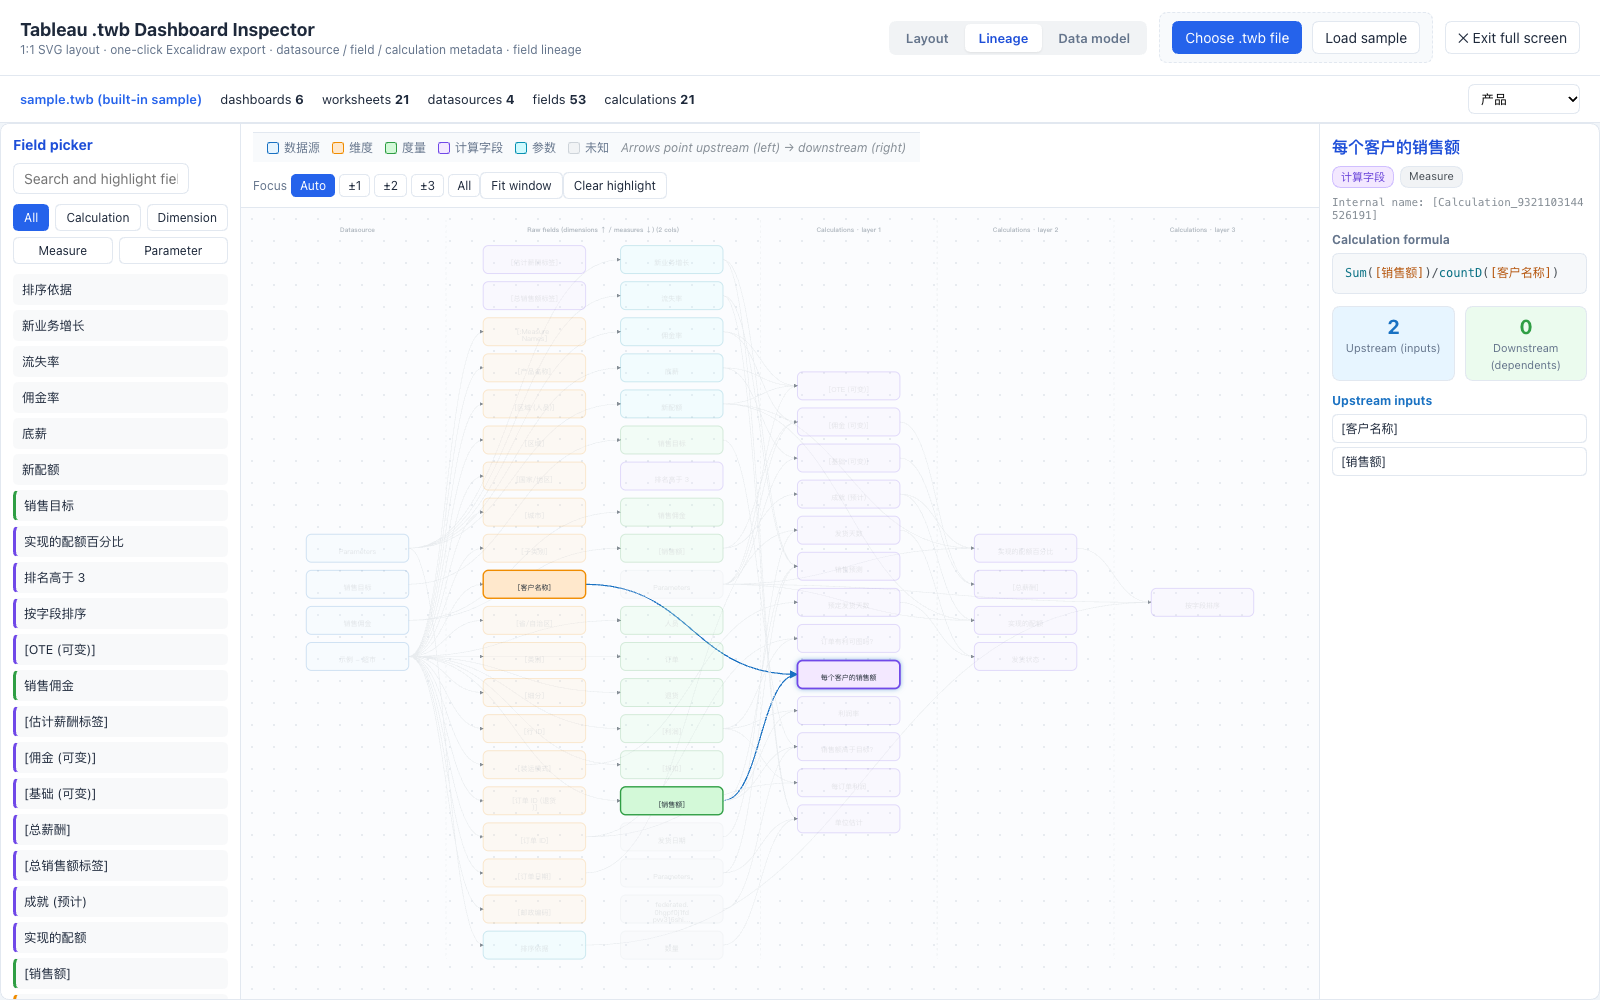
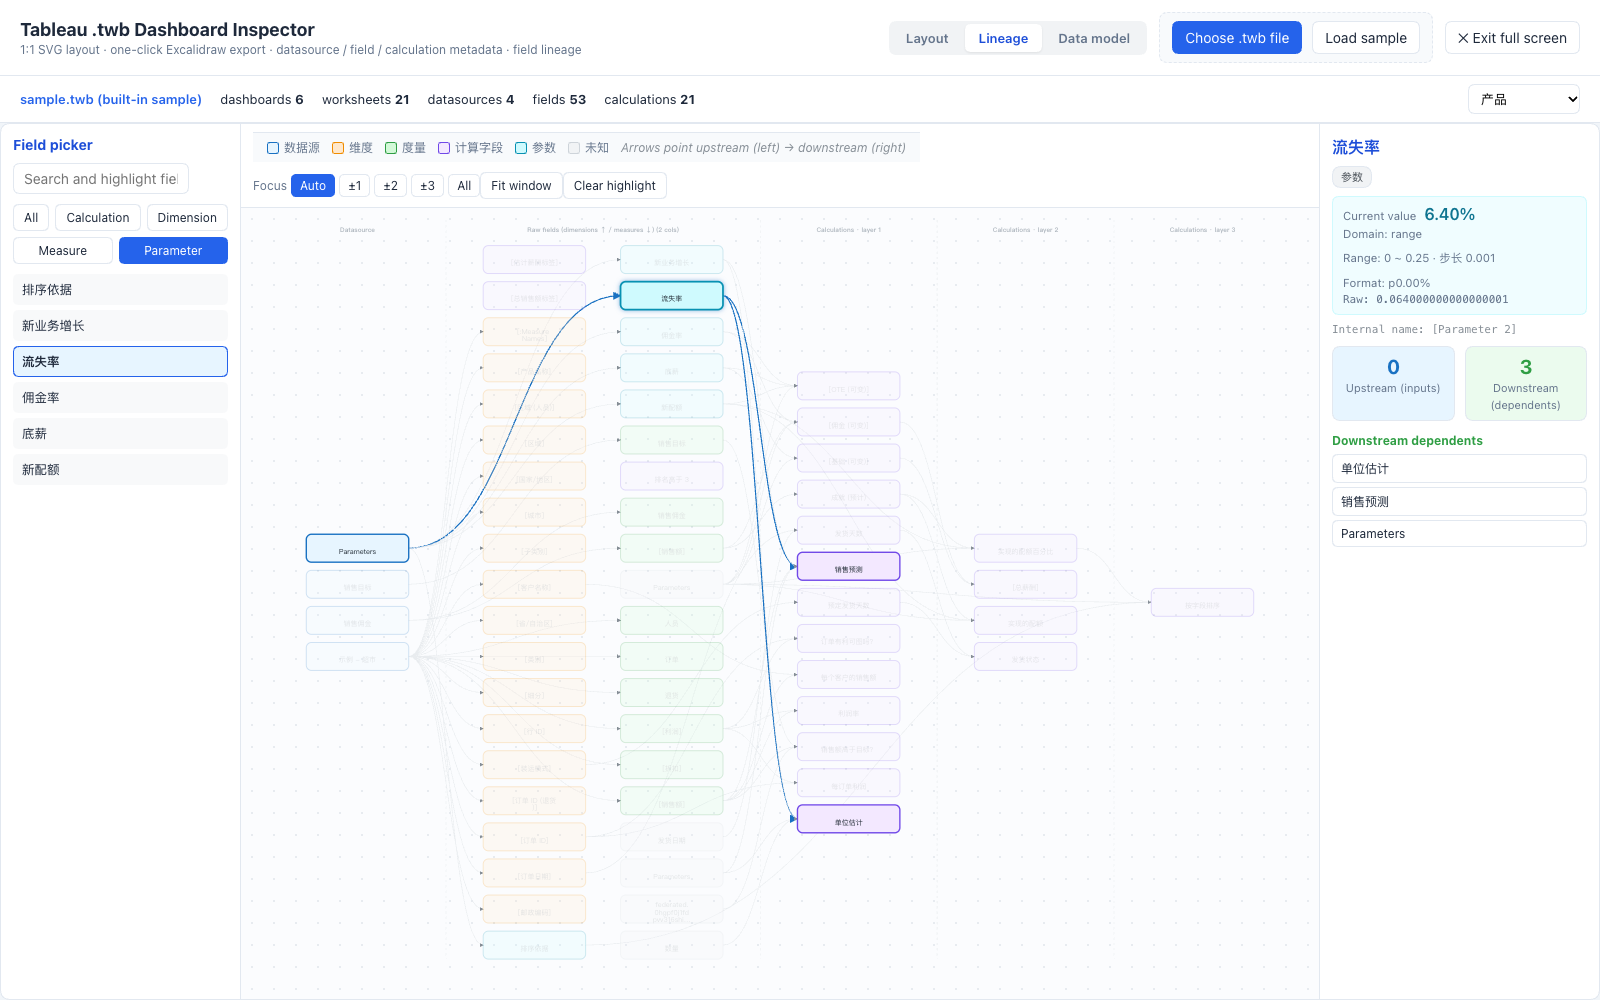
- ✅ Field lineage graph: layered dependency graph — datasource → raw fields → calculated fields. Click any node for its upstream inputs / downstream dependents, search, and filter by role (dimension / measure / calculation).
- ✅ Built for large workbooks: above 1,200 nodes the graph auto-focuses on the selected node's ±2 hops (switchable ±1/±2/±3/all), so a 5,000-node workbook stays smooth instead of freezing the panel.
- ✅ Full-screen mode (and no accidental zooming: the lineage graph pans and fits, but no longer zooms on scroll): one click fills the browser window (
Escto exit); layout and lineage refit automatically. - ✅ State persisted: the parsed workbook is cached (with shape validation), so switching panels or reloading the page brings back your file and current view.
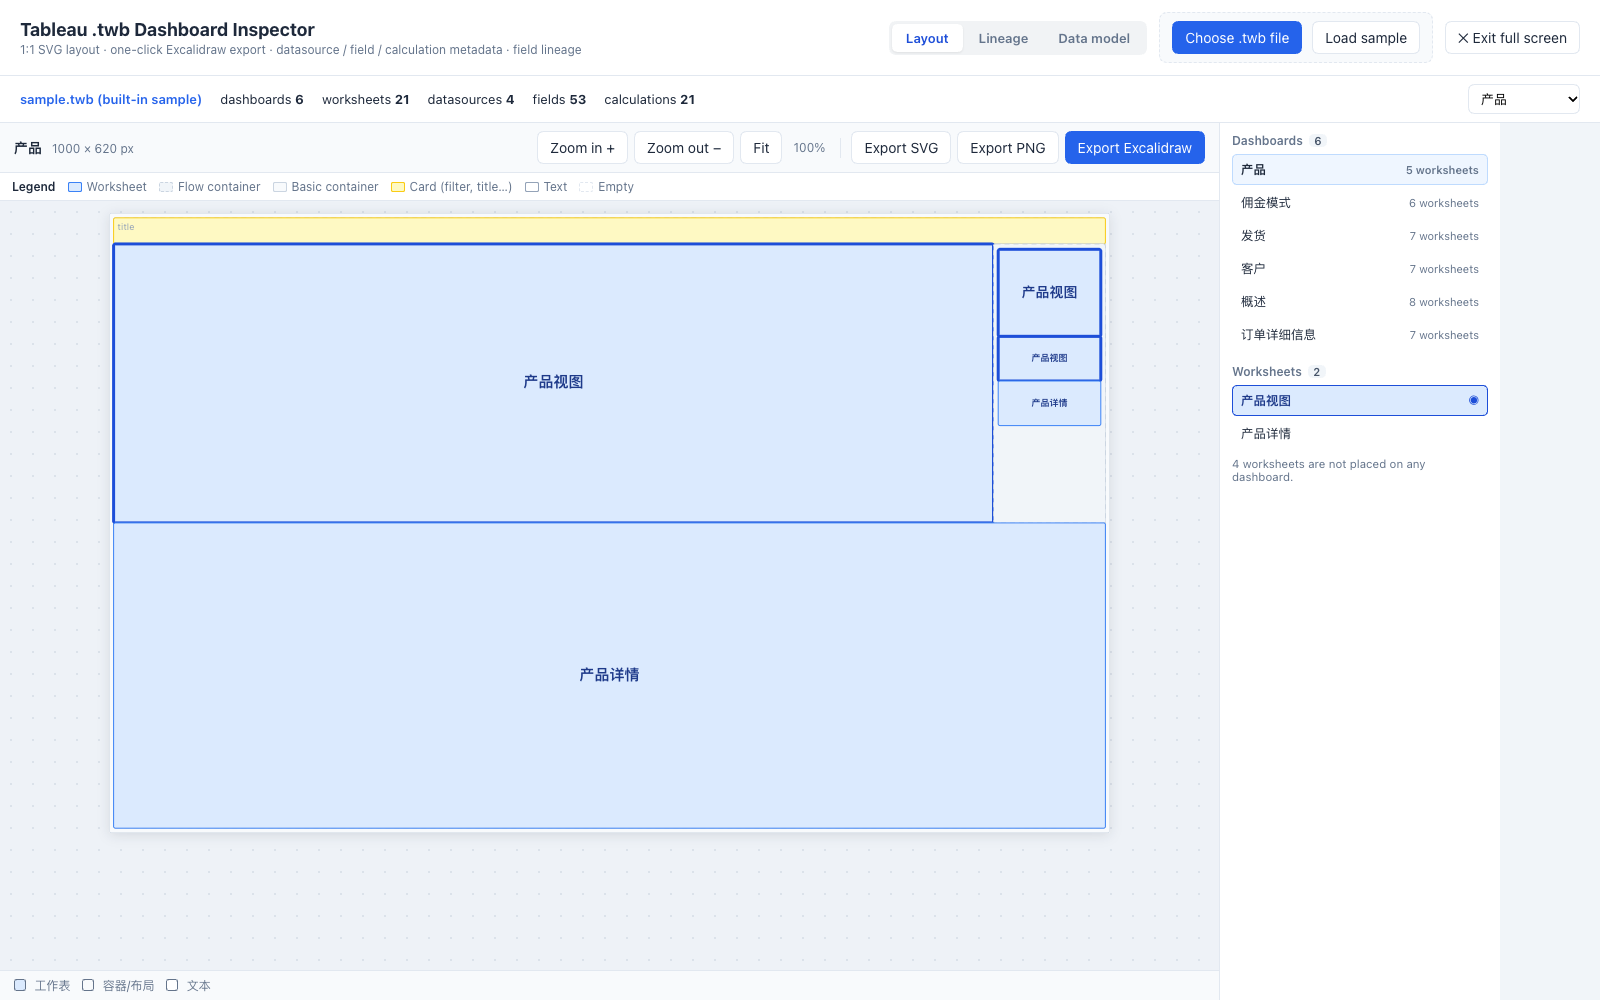
- ✅ Workbook panel: the layout view's right side lists dashboards (worksheet count; click to switch) and the worksheets of the selected dashboard — click one to highlight its zones in the 1:1 layout (click again to clear). Nothing else competes for attention.
- ✅ Custom SQL in context: every custom-SQL datasource sits on the right of the data model; the first one is selected on entry, so the full query is one click (or zero) away, with a copy button and the datasource/connection it belongs to.
- ✅ Parameters as their own class: in the lineage graph parameters are a separate category (own colour, own filter) — never counted as dimensions or measures — and selecting one shows the value formatted by the workbook's own format plus the raw value.
- ✅ Read-only and private: parsing happens in the browser; the file is never uploaded. The Node half only serves a built-in sample route.
Data safety: .twb only, .twbx is refused by design
| Format | What it contains | This plugin |
|---|---|---|
.twb |
Metadata only — XML with connection info, field definitions, calculation formulas, dashboard zone layout. No data rows. | ✅ Supported |
.twbx |
A zip package that can embed data extracts (.hyper / .tde), images, and more |
❌ Refused on purpose |
Refusing .twbx is a deliberate security decision: a packaged workbook can carry your full dataset, and pulling that into an inspection flow widens the data-exposure surface for no benefit. The plugin only ever reads data-free .twb metadata. If you pick a .twbx you get an explicit message telling you to Save As → .twb in Tableau.
Screenshots
Where it lives — a panel row in the left sidebar; the viewer opens as a full page beside your conversation
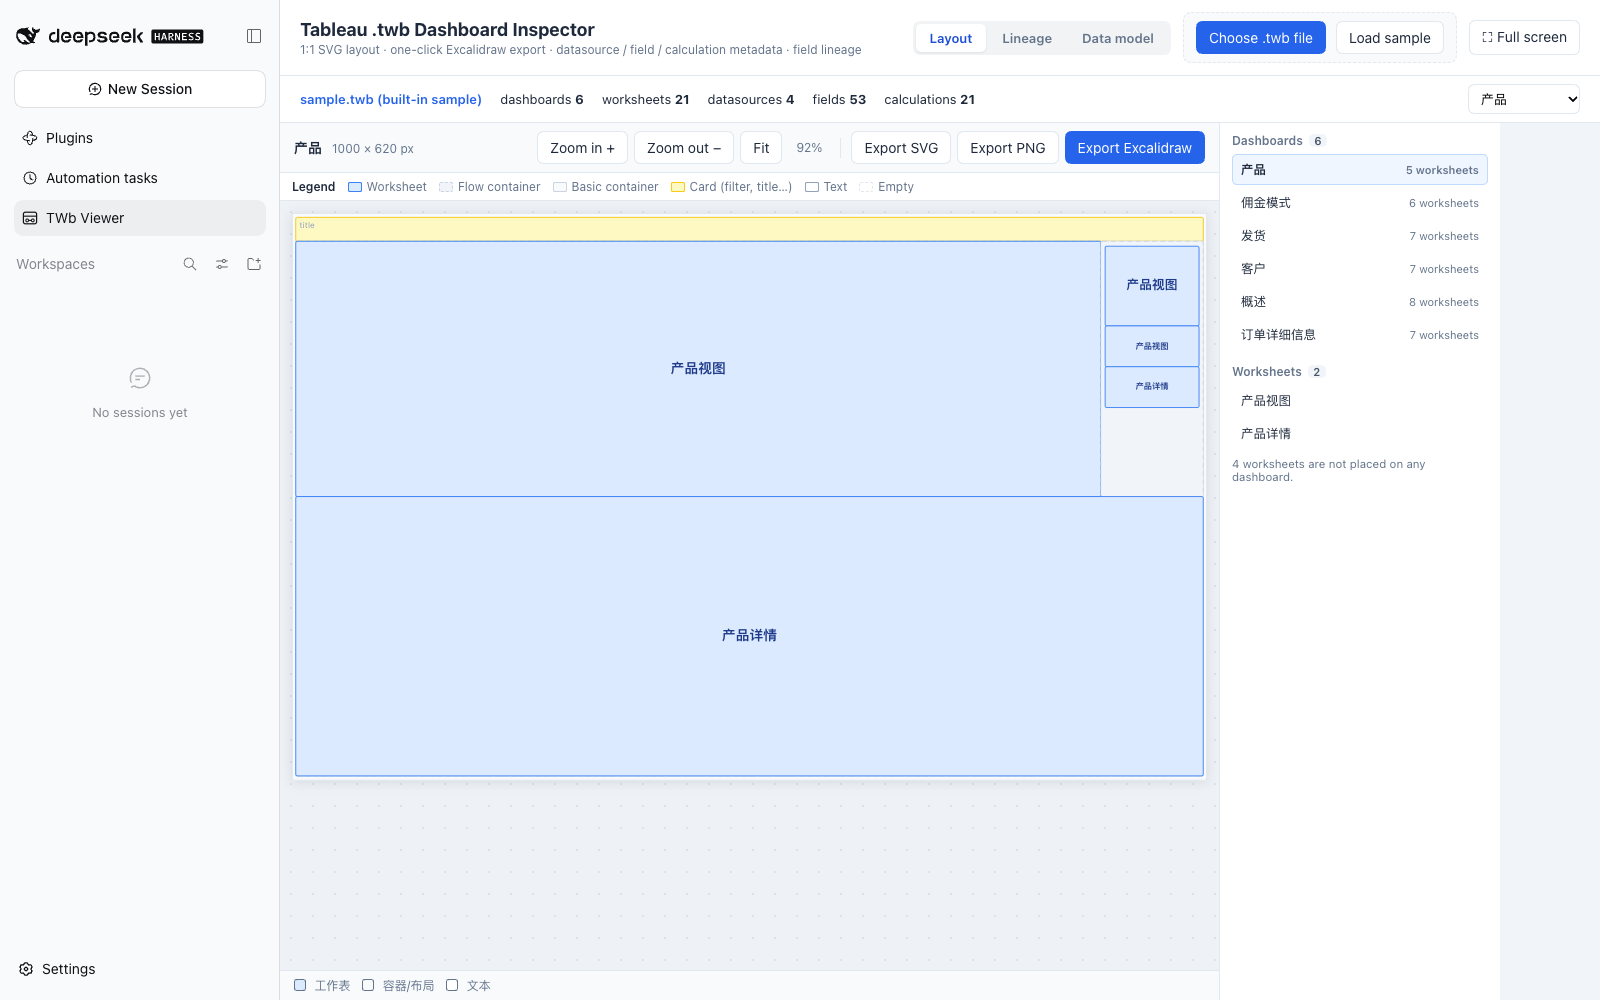
Dashboard layout — 1:1 SVG rendering of every zone, with SVG / PNG / Excalidraw export
Field lineage — datasource → raw fields → calculated fields; click a node for up/downstream
Data model — tables, join types, ON conditions and cardinality (synthetic workbook; client files never leave the machine)
Parameters — current values formatted the way the workbook formats them, raw values kept for verification
Custom SQL — every custom query in one list, ready for scope confirmation
Workbook panel — dashboards and worksheets only: click a dashboard to switch, a worksheet to jump to where it is used
Install
Requires a working DSH Web setup (dsh web). Installing a plugin writes into $DSH_HOME/profiles/web and restarts with dsh web.
1. Straight from GitHub (recommended)
dsh plugin --profile web add github:tableau-China/dsh-tableau-twb-viewer
2. From a GitHub Release (version-pinned tarball)
Every release ships an installable tarball — see Releases:
dsh plugin --profile web add https://github.com/tableau-China/dsh-tableau-twb-viewer/releases/download/v0.2.0/dsh-tableau-twb-viewer-0.2.0.tgz
3. From npm
dsh plugin --profile web add dsh-tableau-twb-viewer
4. From a local checkout (development)
git clone https://github.com/tableau-China/dsh-tableau-twb-viewer.git
dsh plugin --profile web add ./dsh-tableau-twb-viewer
Restart
dsh webafter installing — the client plugin list is scanned at boot. Uninstall withdsh plugin --profile web remove dsh-tableau-twb-viewer.
Usage
- Open DSH Web and click TWb Viewer in the left sidebar. The built-in sample loads automatically.
- Replace it with your own file: click Choose .twb file or drag a
.twbonto the uploader. - Layout tab: 1:1 dashboard rendering with a zone-type legend (worksheet / container / card / text / empty); zoom, pan, fit, hover a zone for its size and padding, and export SVG / PNG / Excalidraw.
- Lineage tab: click any node to see upstream/downstream lineage; search and filter fields; use the Focus control to show ±1/±2/±3 hops or the whole graph.
- Data model tab: tables, join types, ON conditions and cardinality; click a table for its datasource and physical name, or a join for its detail.
- ⛶ Full screen for large workbooks;
Escor ✕ Exit full screen to come back. - The right-hand metadata panel covers datasources, fields, calculations, worksheets, and the Custom SQL inventory.
Troubleshooting
| Symptom | Fix |
|---|---|
| No "TWb Viewer" row in the sidebar | Restart dsh web, then hard-refresh the browser tab (Cmd+Shift+R / Ctrl+F5) — the tab may still run the pre-install bundle. |
| "This is not a valid Tableau workbook" | The file must be a .twb (XML). If you only have a .twbx, open it in Tableau and Save As → .twb. |
A .twbx was refused |
Working as intended — see Data safety. |
| Very large workbook feels slow | The lineage graph already auto-focuses above 1,200 nodes; use the Focus control (±1 hop) to narrow further. |
Development
npm install              # esbuild / xmldom / puppeteer-core (dev-only)
npm run build            # src/ -> lib/client.js (DSH ModuleLoader bundle)
npm run verify           # snapshot tests: parse / graph / layout / tokenizer baselines
npm run verify:update    # regenerate baselines after an intended change
npm run verify:reference # optional: byte-for-byte diff against the original implementation
npm run bench            # performance curve + O(n²) regression guard
npm run gen-css          # regenerate the scoped stylesheet from the source CSS
End-to-end test in a real browser (needs local Chrome and dsh on PATH):
./test/e2e-boot.sh 3199     # terminal A: boots an isolated DSH instance, prints a token URL
TWB_URL="http://127.0.0.1:3199/?token=..." npm run e2e   # terminal B: headless Chrome, 72 assertions

# also verify large-workbook focus behaviour
TWB_LARGE_FIELDS=1500 TWB_URL="..." npm run e2e
npm 11.16+ blocks dependency build scripts by default;
package.jsoncarries an explicitallowScriptsentry foresbuild, otherwisenpm installleaves esbuild without its binary.
Structure
dsh-tableau-twb-viewer/
├── package.json           # dsh.bundle (config layer) + dsh.client (web plugin declaration)
├── cordis.patch.yml       # bundle patch: inserts the plugin row
├── index.js               # Node half: serves the built-in sample route (lazy, degradable)
├── src/
│   ├── parser.js          # .twb XML parsing (dashboard zones / datasources / fields / formulas)
│   ├── graph.js           # lineage graph + layered layout + up/downstream reachability
│   ├── formula.js         # calculation formula tokenizer / highlighter
│   ├── app.jsx            # all UI components + plugin entry (settings.section)
│   ├── plugin.css         # plugin-owned styles (full screen, focus control)
│   └── style.css          # scoped app styles (.twb-root prefix, generated by gen-css.mjs)
├── build.mjs              # esbuild -> lib/client.js (ModuleLoader factory format)
├── lib/client.js          # build artifact (shipped)
└── test/                  # snapshot tests, benchmark, headless-Chrome e2e
Compatibility
| DSH version | Status |
|---|---|
0.1.0-rc.6 |
✅ development baseline (first release) |
0.2.1-alpha.2 |
✅ verified end-to-end (72 assertions incl. zh/en switching, data model, custom SQL, auto-loaded sample, large-graph focus) |
Install mechanisms used: dsh.bundle.patch (makes the package a loaded plugin row) and
dsh.client with an exported ./client bundle (injected into the browser module graph by
client-modules). The UI registers itself into the settings.section slot, and the Node half
uses the webServer service for the sample route.
Author
Yupeng Wu (@tableau-China) — Tableau & data-visualisation practitioner.
No comments yet. Be the first to write one.