dsh-prefill-speed-stats
dsh-prefill-speed-stats: Show prefill speed directly in the status bar. 【For: deepseek-harness-v0.2.0-rc.2】
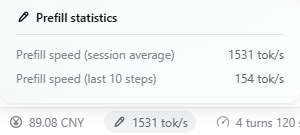
It adds one cell left of the shipped session-statistics strip, showing the session-average prefill speed, and opens a two-row dialog with the session average and a last-N-steps window.
Install
Two ways in. Both end with the same two steps: fully restart the app — the browser bundle is snapshotted when the boot graph is composed, so a page refresh is not enough — and then switch the new plugin on in the plugin panel on the left.
pnpm 11.7.0 is recommended. If pnpm is not installed yet:
npm install -g pnpm@11.7.0
A. From npm — nothing to clone:
Add the package to your DSH profile — its directory is
<dsh home>/profiles/<profile>, and this plugin targets thedesktopprofile — or use the plugin manager (Settings → Plugins, or theplugin_manageragent tool):pnpm add dsh-prefill-speed-statsWith DeepSeek Harness in its default location:
cd "$env:USERPROFILE\.dsh\profiles\desktop" ; pnpm add dsh-prefill-speed-stats     # Windows
cd ~/.dsh/profiles/desktop ; pnpm add dsh-prefill-speed-stats                      # macOS / Linux
Check that the package name is listed in
dsh.profile.bundlesin that profile'spackage.json(installing through the plugin manager does this for you).Restart the app.
Open the plugin panel on the left and switch the new plugin on:

B. From this repository — source, offline, or a version npm does not serve:
pwsh -File .\install.ps1               # Windows
sh ./install.sh                        # macOS / Linux
pwsh -File .\install.ps1 -From npm     # …or install the published package instead
The script performs steps 1–2 for you, backs up the manifest it edits, and prints what is left to do.
What it shows
| Row | Value |
|---|---|
| dock cell | session-average prefill speed, in tok/s |
Prefill speed (session average) |
Σ uncached prompt tokens ÷ Σ prefill windows over the whole log |
Prefill speed (last N steps) |
the same ratio over the last (up to 10) measured steps — the label names the count it really averaged |
uncached tokens is usage.inputTokens: the part of the prompt the provider had to compute, where a
prefix-cache hit costs nothing. prefill window is step/start → first visible token. Steps that never
produced a visible token have no window, so they are excluded from both rows and reported as
session.unmeasuredInputTokens instead.
A low reading usually means there was little new to compute, not that the model is slow. A warm step reads few uncached tokens while the fixed per-request latency (queueing, round trip, KV-cache read) stays the same, so its figure collapses toward zero; the session average amortizes that fixed part, the last-N window does not. The figure counts everything in the window, so it is a lower bound on true prefill throughput.
Files
| File | Role |
|---|---|
index.js |
Host half: registers the sessionSpeed projection |
lib/projection.js |
The fold, its schemas, and the two readings' operands |
lib/stream.js |
First-visible-token timing |
client.js |
Browser half: the dock cell, its dialog, styles and copy |
cordis.patch.yml |
Inserts the Host row the browser half attaches to |
test/ |
Projection tests — node --test test/projection.test.cjs |
install.ps1 / install.sh |
Install into a DSH profile — links this checkout, or -From npm for the published package |
Notes
- Runs inside DeepSeek Harness.
- Sits left of the shipped session-statistics strip; the sibling
dsh-show-balancecell, when installed, sits to its left. - The reading updates as the session grows; there is nothing to configure.
- Unknown events and malformed log records are ignored rather than fatal, so a future harness event can only cost accuracy, never the session.
- Unofficial plugin; it uses only public surfaces (the
sessionSpeedHost projection and theconversation.composer.dockslot).
License
MIT — see LICENSE.
dsh-prefill-speed-stats:直接在状态栏显示 prefill 速度。【适用于:deepseek-harness-v0.2.0-rc.2】
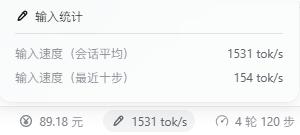
位置在内置「会话统计」左边;点开可看会话平均与最近 N 步两个读数。
安装
两种方式,最后两步一样:完全重启应用——浏览器 bundle 在启动组合时快照,刷新页面不够——重启后在左侧的插件面板里把新装的插件打开。
建议使用 pnpm 11.7.0。 如果还没安装 pnpm:
npm install -g pnpm@11.7.0
A. 从 npm 安装 —— 不用 clone:
安装到 DSH profile —— profile 目录是
<DSH 主目录>/profiles/<profile>,本插件面向desktopprofile —— 或用插件管理器(设置 → 插件,或 agent 的plugin_manager工具):pnpm add dsh-prefill-speed-statsDeepSeek Harness 装在默认位置时:
cd "$env:USERPROFILE\.dsh\profiles\desktop" ; pnpm add dsh-prefill-speed-stats     # Windows
cd ~/.dsh/profiles/desktop ; pnpm add dsh-prefill-speed-stats                      # macOS / Linux
确认该 profile
package.json的dsh.profile.bundles里有这个包名(用插件管理器装的话它会替你写)。重启应用。
在左侧的插件面板里把新装的插件打开:
B. 从本仓库安装 —— 源码 / 离线 / npm 上没有的版本:
pwsh -File .\install.ps1               # Windows:链接当前克隆
sh ./install.sh                        # macOS / Linux
pwsh -File .\install.ps1 -From npm     # 也可以直接装 npm 上的已发布版本
脚本会替你做完第 1–2 步(并备份它改过的 manifest),然后提示剩下的步骤。
显示内容
| 行 | 值 |
|---|---|
| 状态栏上的格子 | 会话平均输入速度,单位 tok/s |
输入速度(会话平均) |
整个会话的 Σ 未命中缓存 token ÷ Σ 预填充窗口 |
输入速度(最近 N 步) |
同一算法,只统计最近(最多 10)个已测量步;标题会写出它真正平均了几步 |
未命中缓存 token 就是 usage.inputTokens:提供方真正需要计算的那部分提示词,命中前缀缓存的部分不计。预填充窗口 是 step/start → 首个可见 token。始终没产出可见 token 的步没有窗口,因此两个读数都不统计它,其 token 记在 session.unmeasuredInputTokens 里。
读数低通常意味着「这次几乎没新东西要读」,而不是模型慢。 缓存命中的步未命中 token 很少,而每次请求的固定开销(排队、往返、读 KV 缓存)不变,数字自然被压向零;会话平均把这些固定开销摊薄了,最近 N 步没有。由于窗口里的一切都计入分母,这个数字是真实预填充吞吐的下界。
文件
| 文件 | 作用 |
|---|---|
index.js |
宿主半边:注册 sessionSpeed 投影 |
lib/projection.js |
折叠逻辑、schema 与两个读数的算子 |
lib/stream.js |
首个可见 token 的计时 |
client.js |
浏览器半边:格子、面板、样式与文案 |
cordis.patch.yml |
插入宿主行(浏览器半边挂在它上) |
test/ |
投影测试 —— node --test test/projection.test.cjs |
install.ps1 / install.sh |
装进 DSH profile(默认链接本地克隆,-From npm 装已发布版) |
说明
- 运行在 DeepSeek Harness 里。
- 位置在内置「会话统计」左边;装了
dsh-show-balance时它在更左边。 - 读数随会话增长自动更新,没有任何需要配置的项。
- 未知事件与畸形日志记录一律忽略而不致命,未来的 harness 事件最多损失精度,不会损坏会话。
- 非官方插件,只使用公开接口(
sessionSpeed宿主投影与conversation.composer.dock槽位)。
许可
MIT,见 LICENSE。
No comments yet. Be the first to write one.