dsh-llm-latency
A passive LLM latency dashboard for DeepSeek Harness. See how long models take to respond, compare vendors, and inspect individual requests without starting extra model calls.
What's in v0.2.0
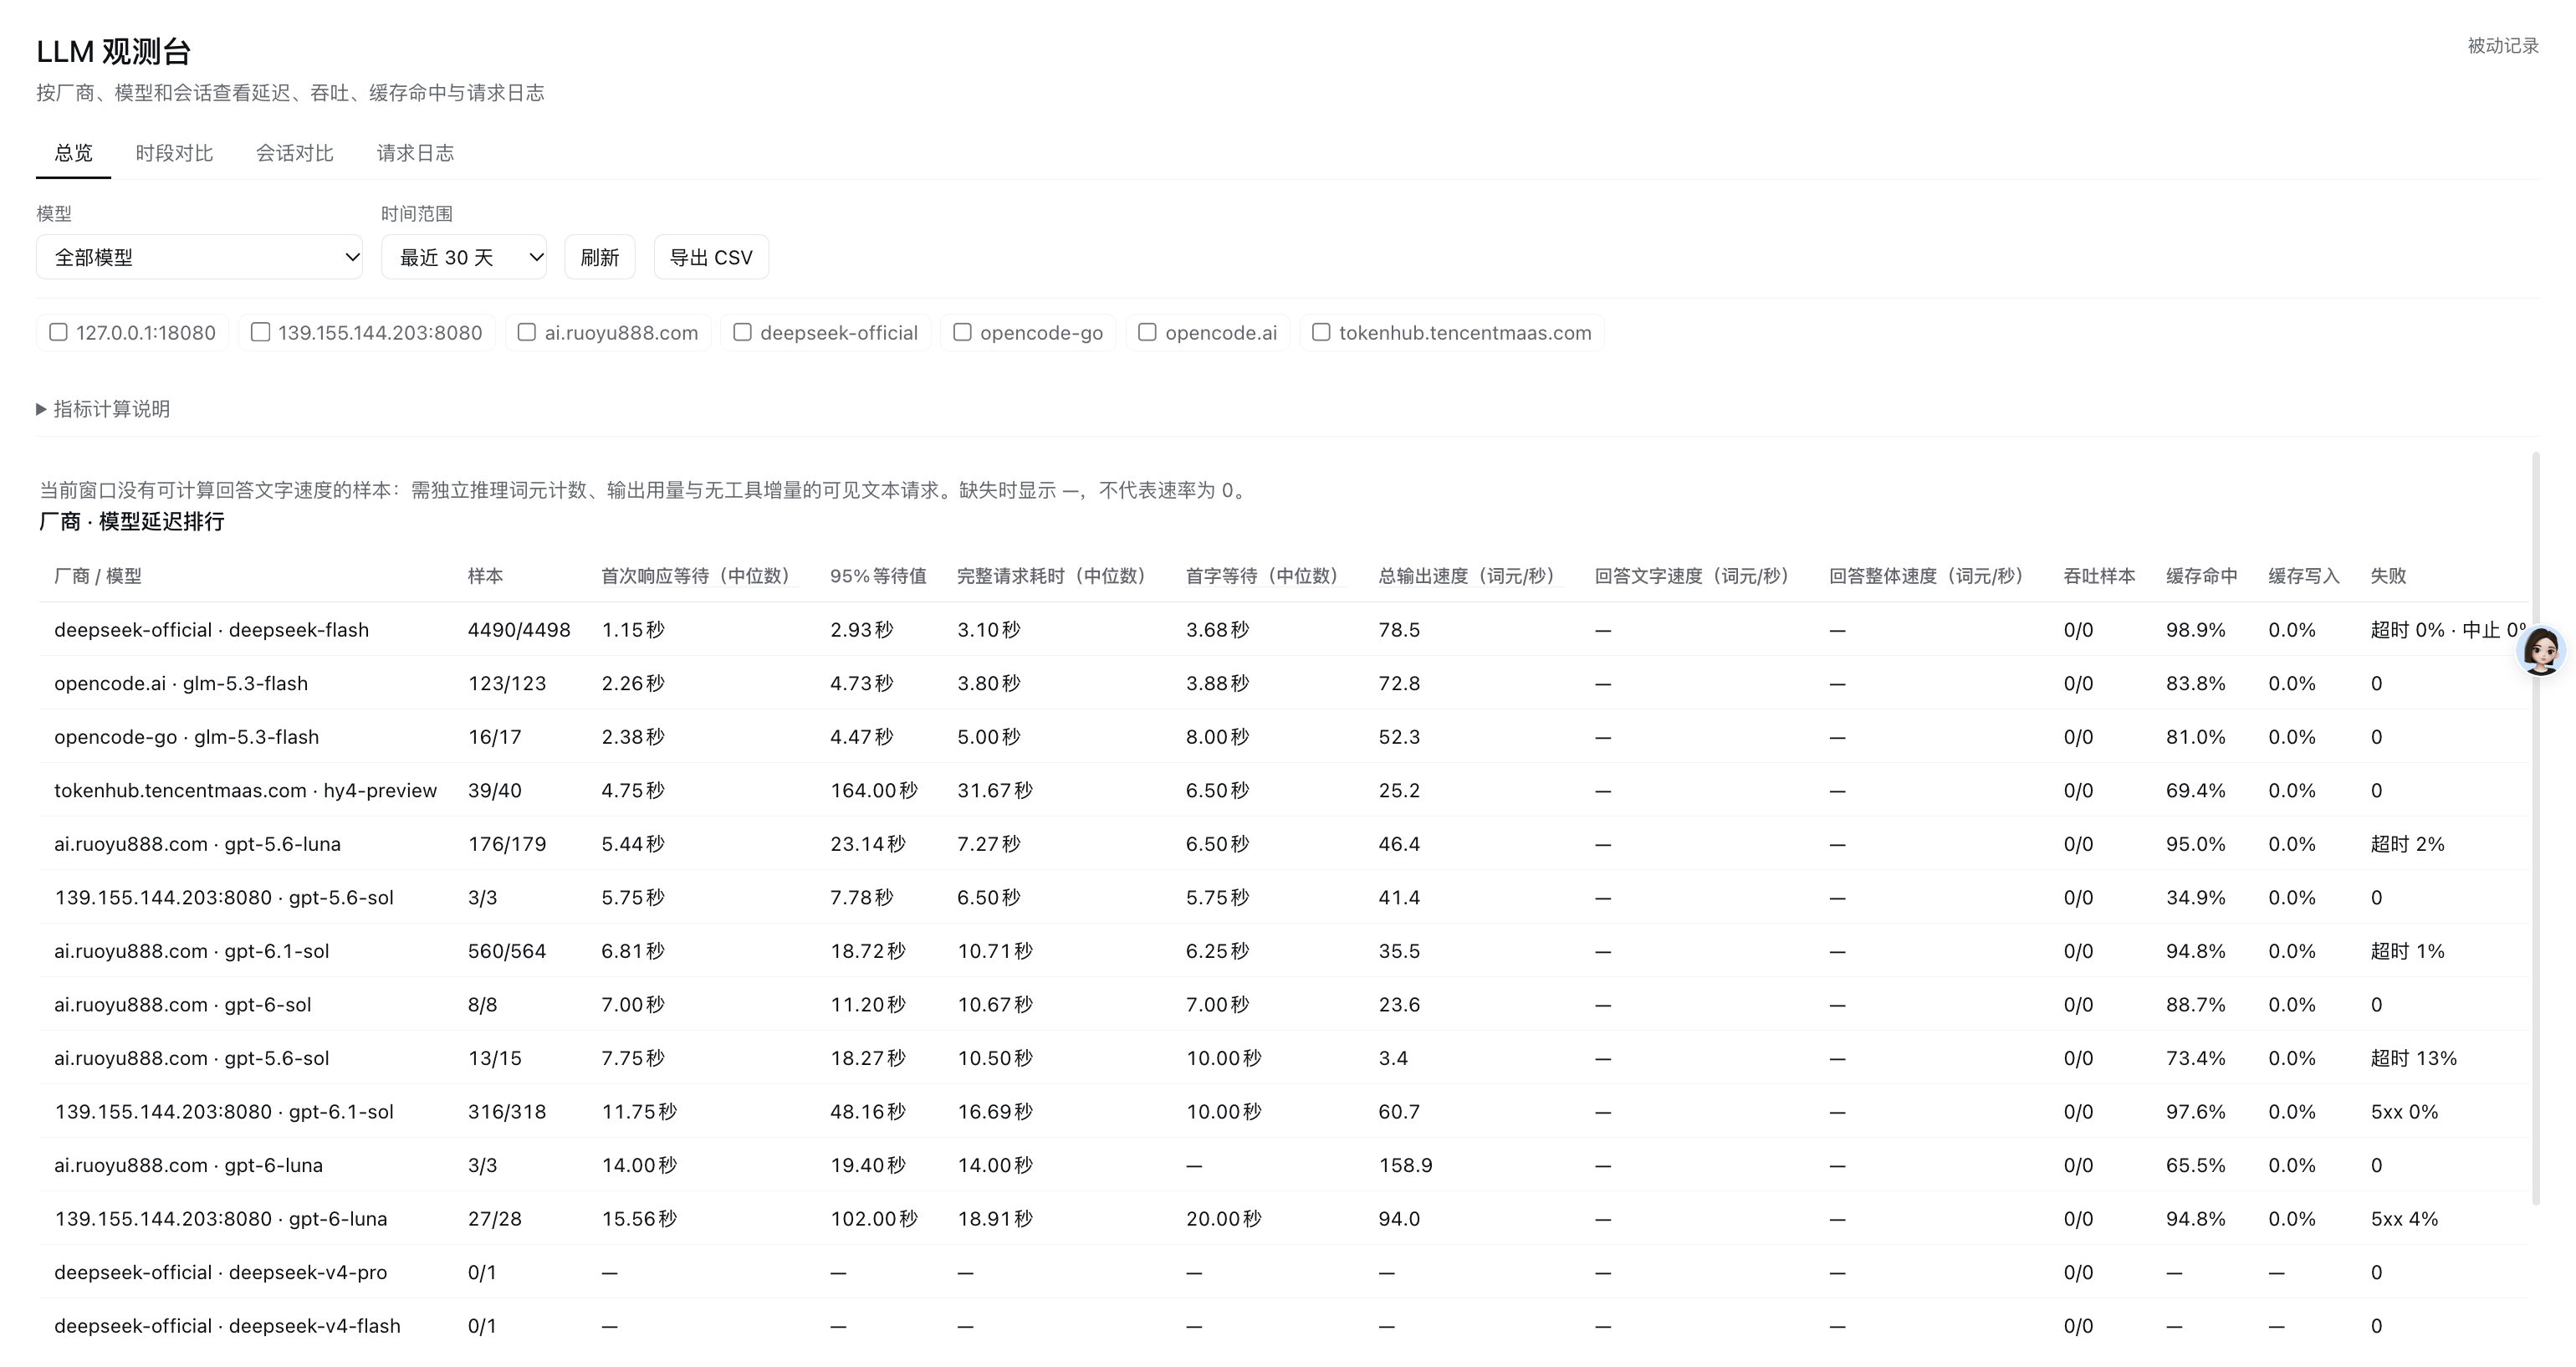
- Native dashboard: open LLM Latency in the DSH sidebar. Overview, time-window comparison, session comparison, and request log share the existing recorded data.
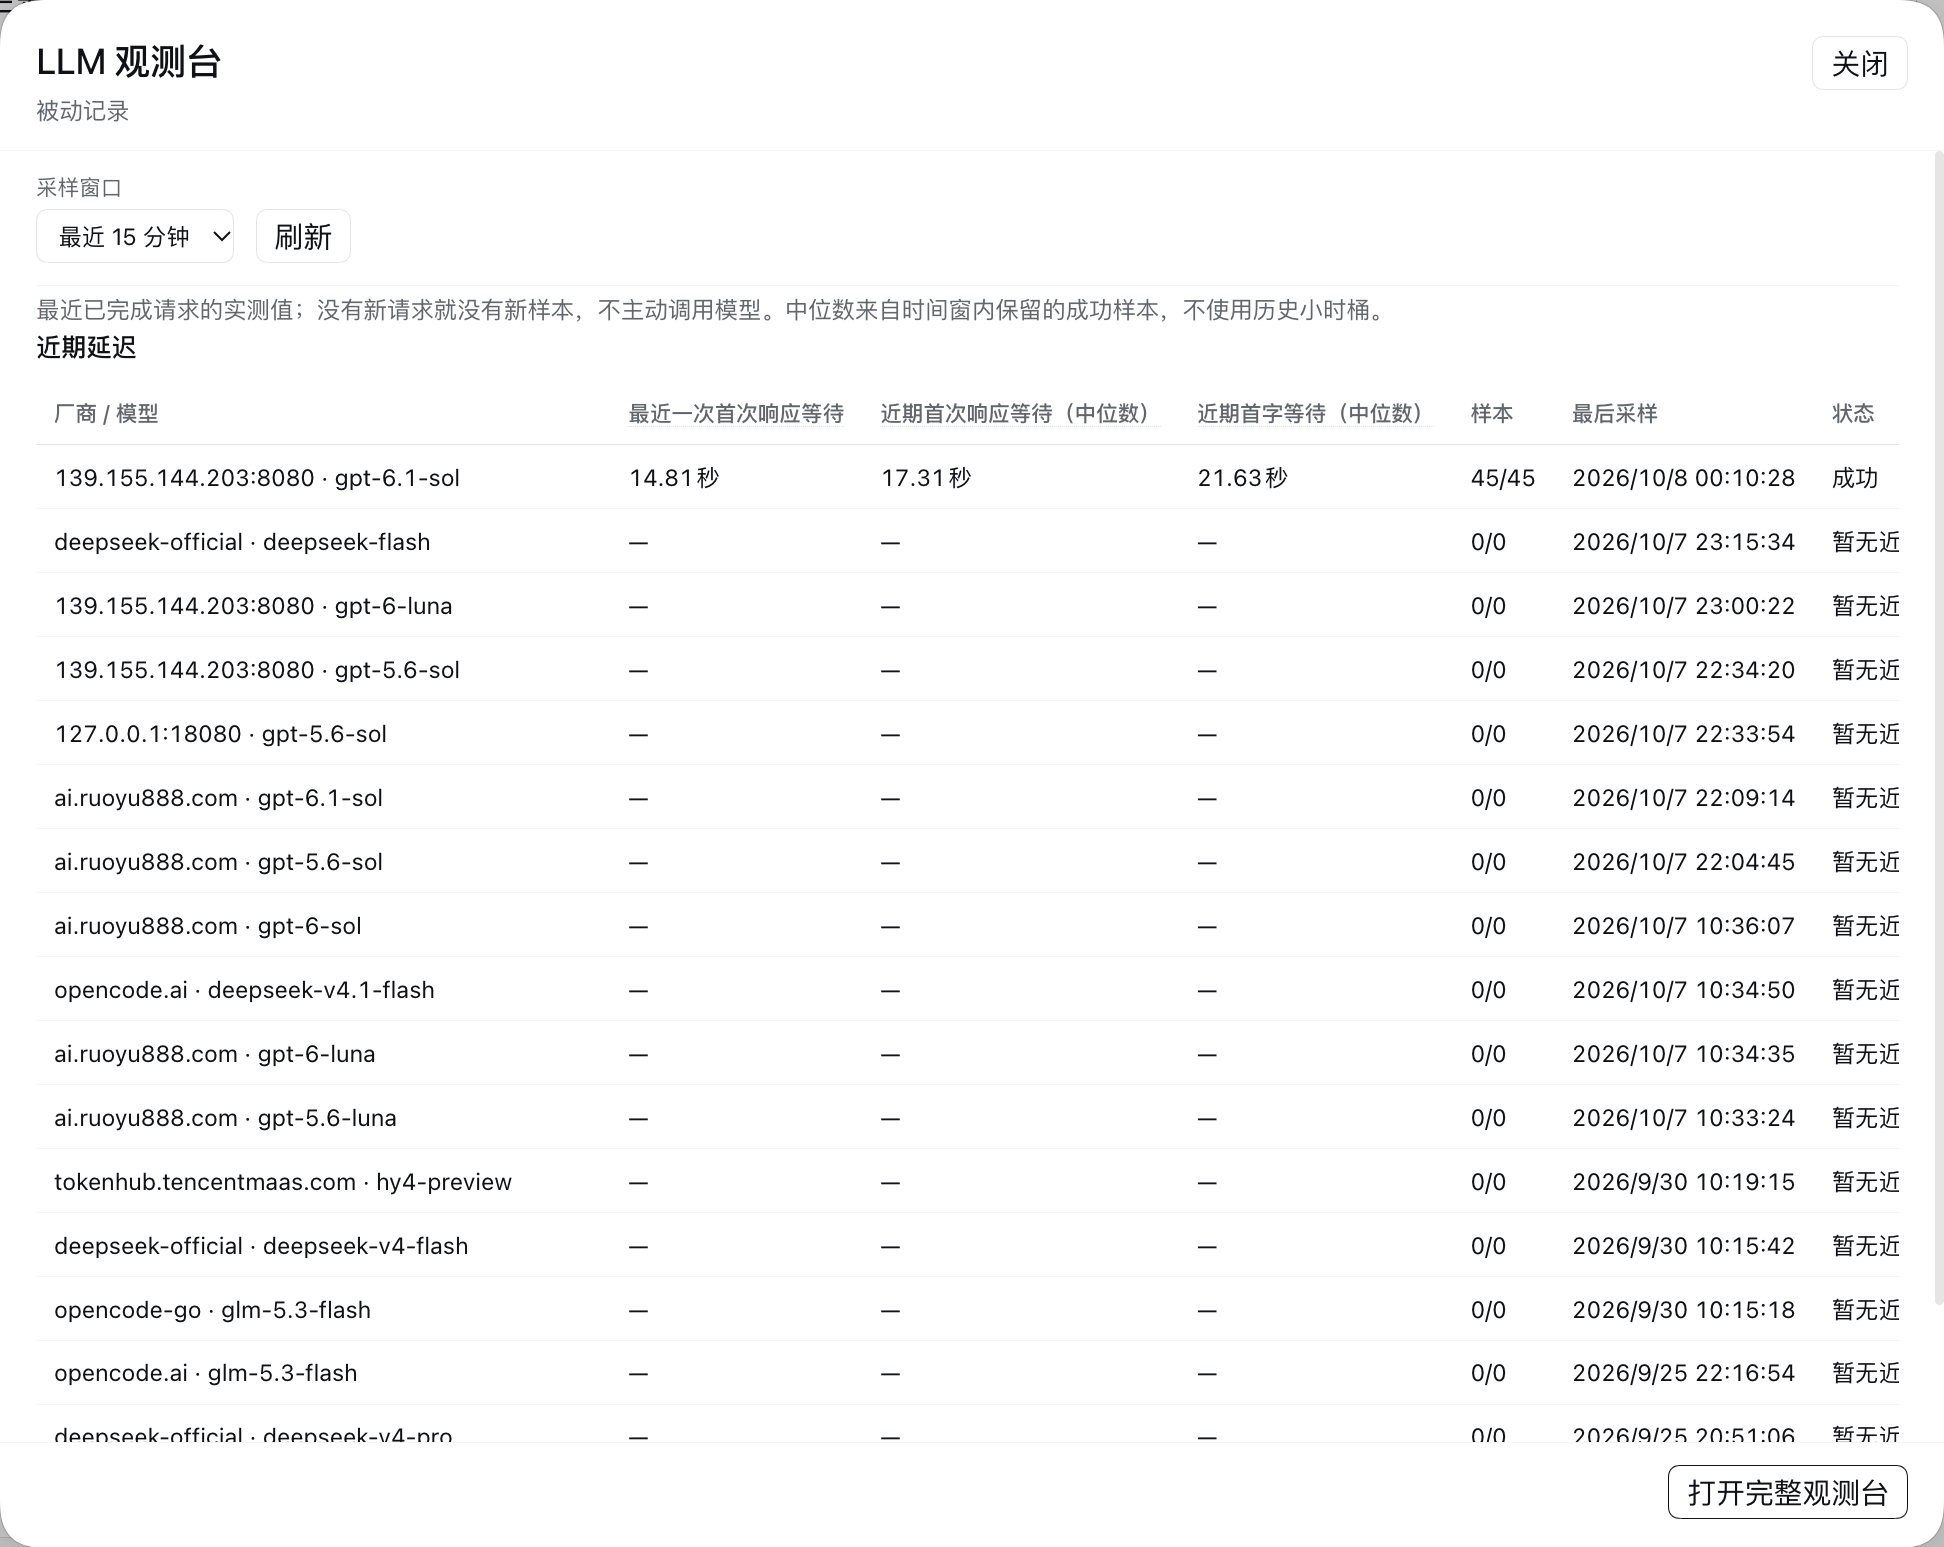
- Composer quick view: the Latency button opens recent latency. Select the last 15 minutes, hour, or three hours; inspect the latest response delay, median response delay, median first-text delay, successful/total samples, and last sampling time.
- Honest freshness: idle models show No recent samples. The panel never substitutes a historical average for a current measurement or probes an unused model.
- Metric explanations: hover or keyboard-focus latency and total-output headings for their timing and eligibility rules. The native interface follows DSH's theme and locale; Chinese metric names use plain Chinese.
- Legacy rate restored: total output speed remains available alongside strict visible-answer output and overall rates. Missing reasoning usage does not hide the legacy value or turn missing visible rates into zero.
- Existing interfaces retained:
/llm-latency/, JSON endpoints, thelatency_reporttool, recorded statistics, and CSV export remain available.
Screenshots
Recent quick view — completed calls only, with last-sampling times and explicit idle states.
Native dashboard — total output speed and visible-answer rates are separate; hover explanations describe the measurements.
Install or update
Tested with DeepSeek Harness 0.2.1-alpha.1, Node.js 22, and the Web profile. Harness extension APIs are pre-stable; compatibility with other versions is not guaranteed.
Install the tagged GitHub version:
dsh plugin --profile web add 'github:shengbinxu/dsh-llm-latency#v0.2.0'
Alternatively, download the .tgz from GitHub Releases and install that file:
dsh plugin --profile web add ./dsh-llm-latency-0.2.0.tgz
Refresh the GUI after installation. If activation requires a restart, restart the existing DSH service using its normal service manager. The distributed package includes built Host files and its browser entry; installation does not require a build step.
Use the plugin
| Entry | What it shows |
|---|---|
| DSH sidebar → LLM Latency | Full dashboard with four views and CSV export |
| Conversation composer → Latency | Exact recent latency from retained completed-call samples |
http://127.0.0.1:3080/llm-latency/ |
Retained standalone dashboard; use your configured host/port |
latency_report tool |
Recorded vendor/model or session comparison |
The quick panel refreshes every 10 seconds while open and stops on close. Close, Escape, and outside clicks dismiss it; Open full dashboard switches to the native page without changing the selected conversation.
Recent windows use request start timestamps and exact retained samples. Medians include only successful calls with that metric; first-response and first-text sample sets can differ. Ring limits can reduce the retained count. No recent sample means this installation has no fresh measurement, not that the model is unavailable.
The full dashboard defaults to the last 30 days. Model/vendor/time filters apply to overview and cross-vendor comparison. Session comparison summarizes full sessions; use single-model sessions and similar prompts. Request logs support search, status, model, time, and one selected vendor. Historical percentiles use overlapping whole-hour buckets, so boundary hours may contain calls outside the requested window.
What the metrics mean
| Metric | Calculation |
|---|---|
| First-response wait / TTFT | First stream pull → first nonempty text, reasoning, or tool-call delta |
| First-text wait | First stream pull → first nonempty visible-answer text delta; reasoning and tools do not count |
| End-to-end duration | First stream pull → stream completion; excludes other tools in the Agent turn |
| Median / p50 | Middle eligible value; historical dashboard values are histogram estimates, quick-view values are exact |
| p95 | Approximate value that 95% of eligible successful samples do not exceed |
| Total output speed | Legacy cumulative total-output tokens ÷ successful calls' cumulative time from first content to completion |
| Visible-answer output speed | Eligible visible tokens ÷ seconds between first and last nonempty text delta |
| Visible-answer overall speed | Eligible visible tokens ÷ full stream duration, including the initial wait |
| Rate samples | Separate eligible counts for visible-answer output / overall rates |
| Cache hit / write | Cached-read / cached-write tokens ÷ total uncached + cached-read + cached-write input |
Timing starts when the adapter is first pulled, usually when it starts its request, rather than when the user clicks Send. A first response can be reasoning or a tool call before any answer text appears. Browser rendering time is excluded.
Why a visible rate can be —: visible tokens require output usage, a separate reasoning count (explicit zero is valid), visible text, success, and no tool-call deltas. Missing data is not zero. A single text delta supports overall speed only. The tested Harness pi-ai adapter folds reasoning into total output without exposing its separate count; its strict visible rates therefore remain unavailable. No character estimates or assumed zero reasoning counts are used.
Legacy rate limitation: total output may include reasoning, tools, and reported failed-call output, while the old duration denominator includes successful calls only. Failures can inflate this legacy rate. It is retained for compatibility and displayed separately, not presented as pure answer-text speed. JSON and CSV keep tokensPerSecond for this legacy metric and outputTokensPerSecond / overallTokensPerSecond for strict visible rates.
Latency also depends on prompt size, reasoning settings, network conditions, and tool use. Recorded samples describe this installation's requests, not a provider-wide load monitor. Cross-vendor confidence intervals concern TTFT only, not throughput.
Data and configuration
Aggregates persist in $DSH_HOME/llm-latency/stats.json and individual records in $DSH_HOME/llm-latency/requests.jsonl (~/.dsh by default). Auxiliary compaction/title calls appear in the request log but not rankings or the recent panel. Upgrades preserve old latency/cache data; old samples without visible-rate fields contribute no eligible visible-rate samples.
Configure the llm-latency row through the bundle patch or a profile override:
| Key | Default | Meaning |
|---|---|---|
retentionDays |
30 |
Historical aggregation retention |
recentLimit |
2000 |
Exact-sample ring capacity per vendor/provider/model |
sessionLimit |
500 |
Retained sessions |
spikeFloorMs |
10000 |
Slow first-response threshold |
modelAliases |
{} |
Canonical model → provider model IDs |
minSamplesForComparison |
20 |
Minimum successful samples for median confidence intervals |
logLimit |
5000 |
Request-log memory capacity |
logRetentionDays |
7 |
Request-log retention |
statsPath / logPath |
Default data paths | Optional persistence overrides |
Development
npm ci
npm run typecheck
npm run build
npm test
Commit lib/ with its source changes: GitHub installation consumes the built Host files. The browser entry is self-contained JavaScript loaded through the Harness module table and requires no added bundler or separate React installation.
The Host wraps llm/stream and exposes read-only JSON. Native UI contributions register in main, sidebar.panellist, conversation.input.left, and shell.overlay; both browser forms read the same Host data. Resource cleanup belongs to Cordis effects so unloading releases the route and listener. See DESIGN.md for the original data/comparison design.
License
MIT
No comments yet. Be the first to write one.