READMESource: main@f0bc5c39
dsh-function-plot
DeepSeek Harness 插件:让对话支持函数图像绘制,以及把工作区里的 SVG 显示到 Web 页面。
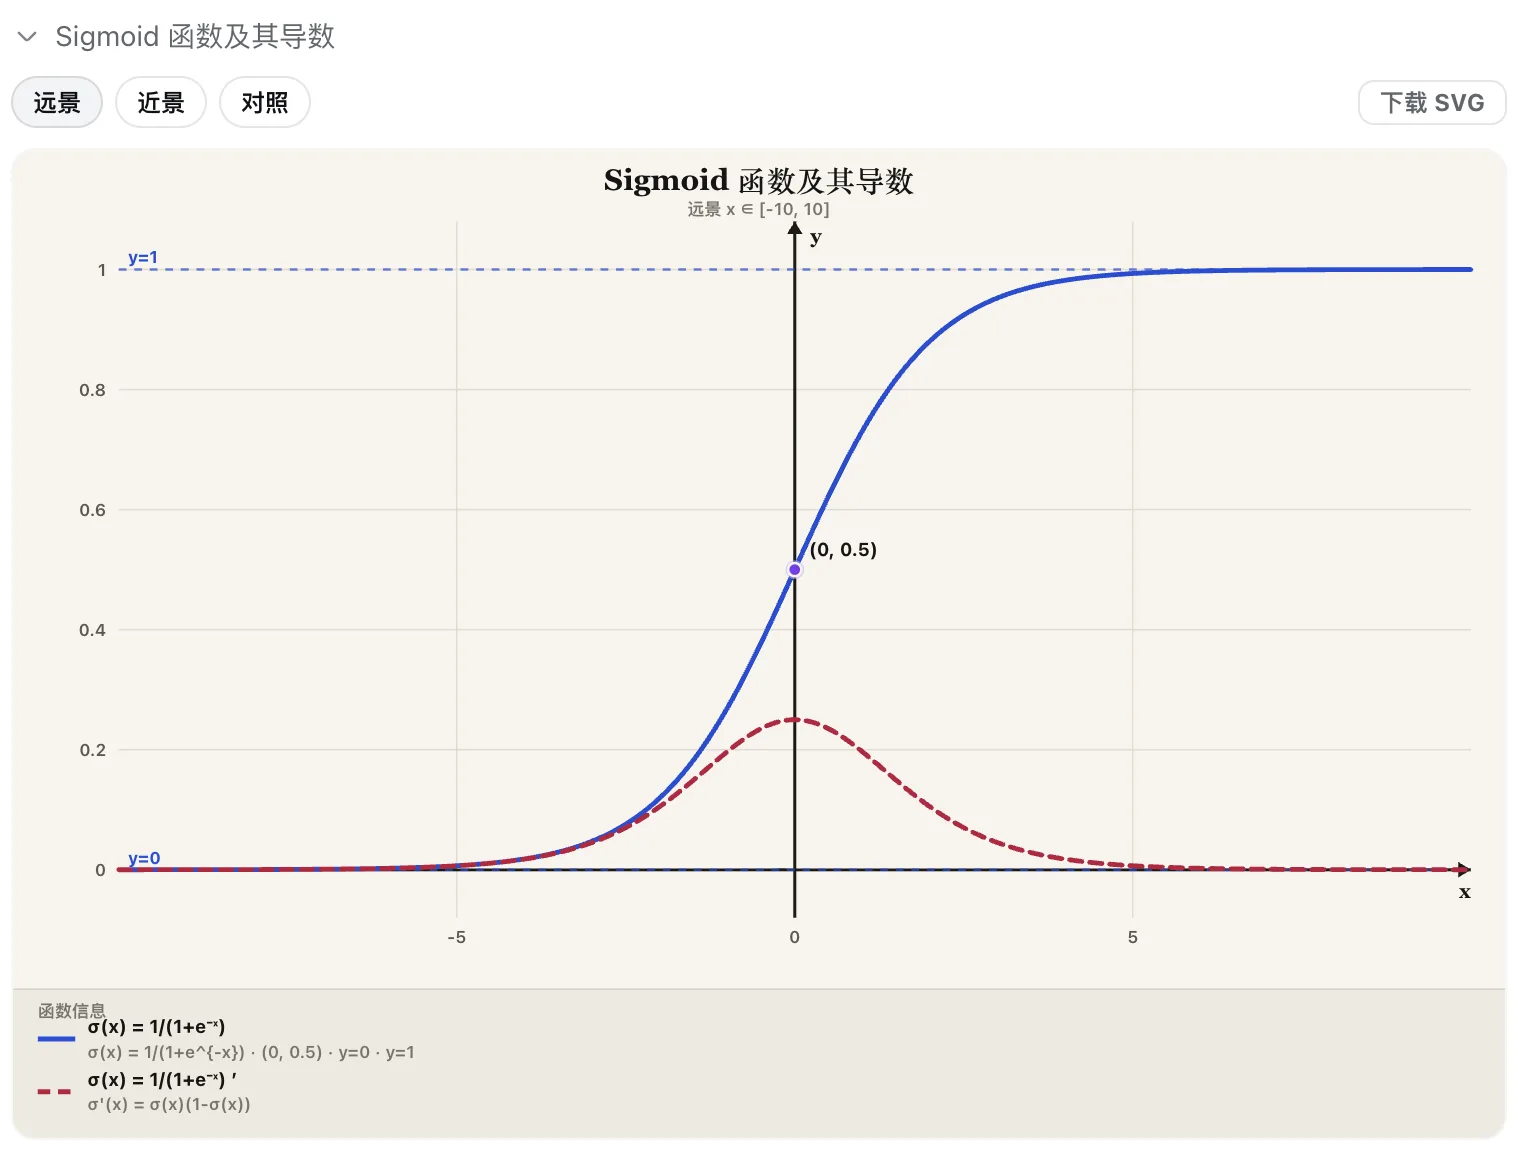
- 画函数:激活函数、分布、课堂曲线;卡片可切换远景 / 近景 / 对照,查看函数信息,下载 SVG
- 显示 SVG:单独把已有图片渲染到对话里,不必经过函数绘图
安装
npm(推荐)
dsh plugin --profile web add dsh-function-plot
dsh web
源码
git clone https://github.com/kirineko/dsh-function-plot.git
cd dsh-function-plot
pnpm install
pnpm build
dsh plugin --profile web add "$(pwd)"
pnpm ≥10 若 add 失败,写入 ~/.dsh/profiles/web/pnpm-workspace.yaml 后重试:
allowBuilds:
  dsh-function-plot: true
使用
| 目的 | 说法 |
|---|---|
| 画函数 | 画 sigmoid;对比 ReLU 和 GELU;画 y = x^2 / 2 |
| 显示已有 SVG | 把 figures/arch.svg 显示在对话里 |
- 标准模式:独立卡片
- PTC:
run_code下的嵌套卡片 - 文件:
.dsh-plots/*.svg
卸载
dsh plugin --profile web remove dsh-function-plot
配置(可选)
默认即可使用,一般不用改。只有要换输出目录、采样数、画布或主题时,才编辑 ~/.dsh/profiles/web/cordis.patch.yml:
- id: function-plot
  name: dsh-function-plot
  config:
    outputDir: .dsh-plots
    samples: 400
    width: 960
    height: 540
    theme: light
No comments yet. Be the first to write one.