dsh-token-usage-stats
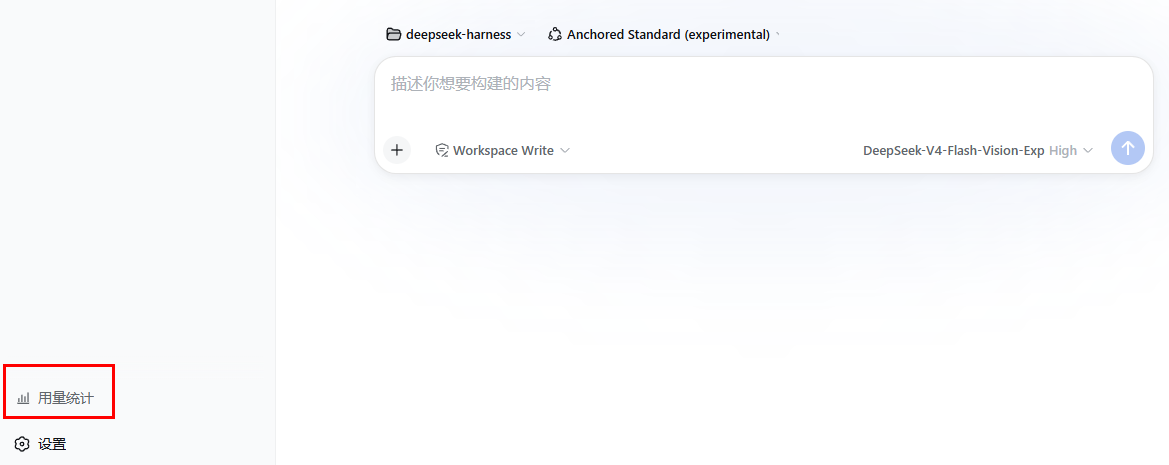
DSH Web 插件:跨会话的 Token 用量、请求次数与可选成本统计(ctx.tokenUsageStats),自带独立仪表盘页面(/token-usage-stats,JSON 数据源 /api/token-usage-stats)以及侧边栏底部入口(页内模态框打开仪表盘)。
截图
侧边栏底部入口 — 点击「用量统计」打开仪表盘
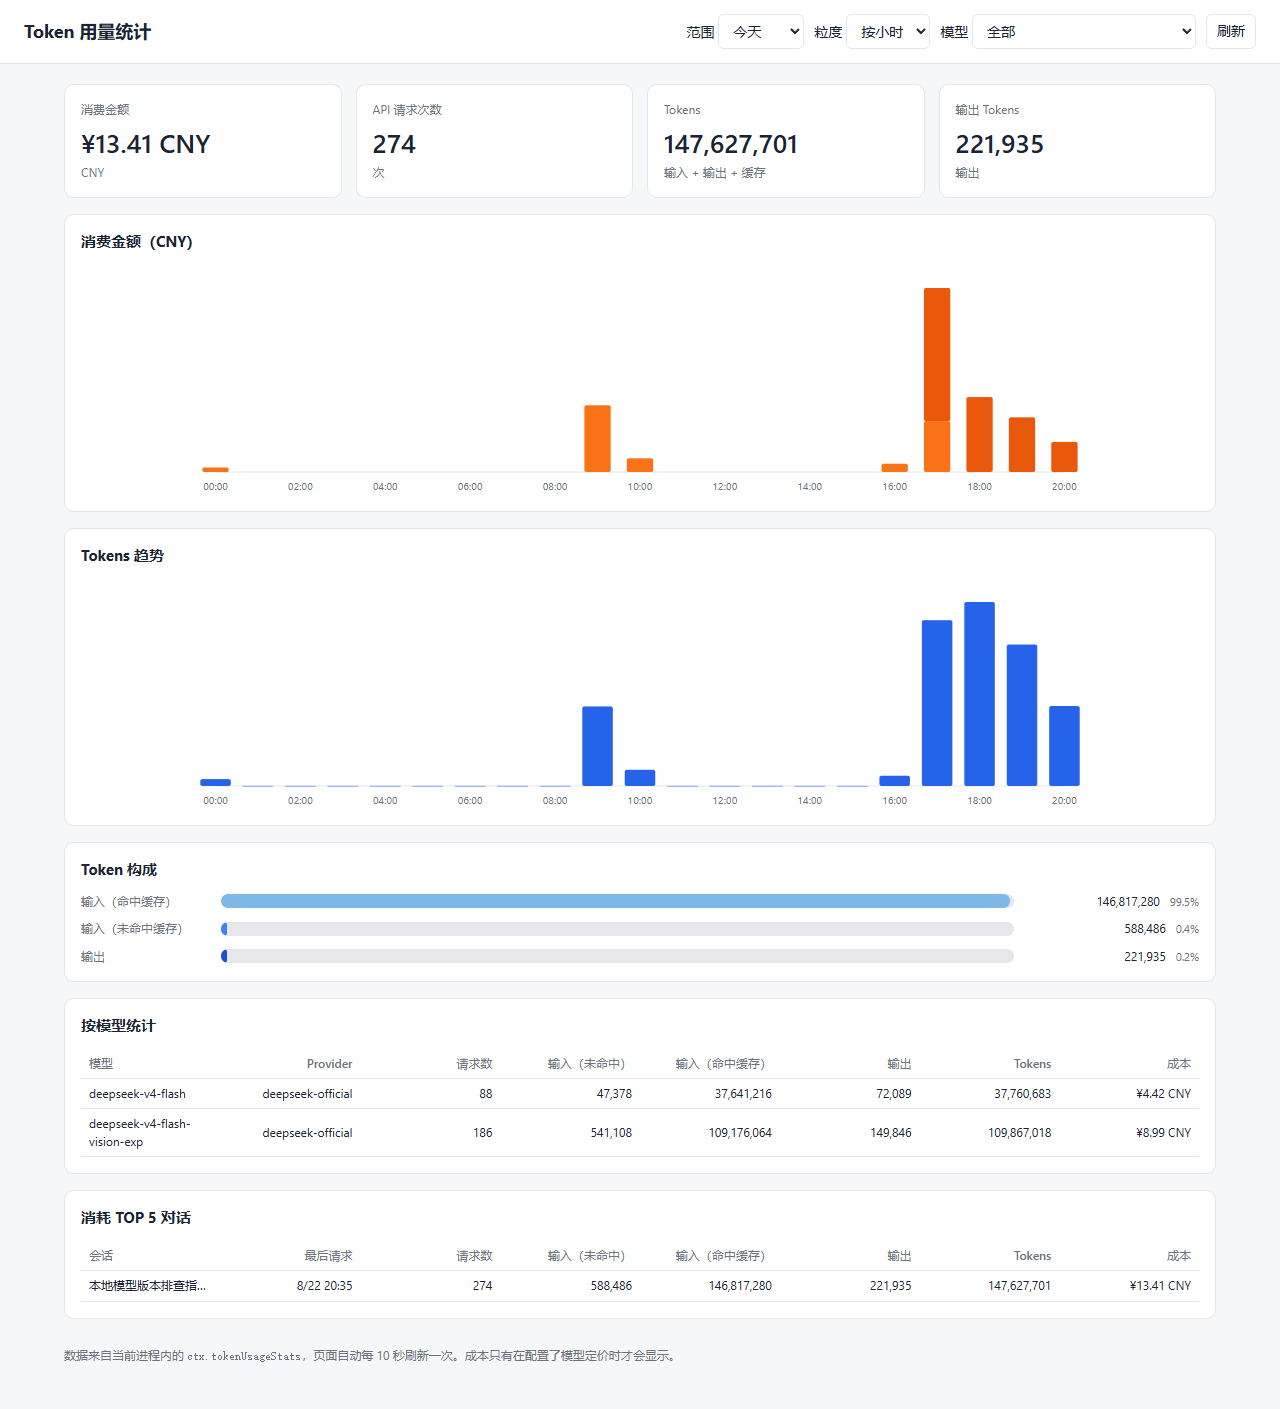
仪表盘 - 今天视图(成本堆叠、token 趋势、构成占比、按模型与 TOP 对话表)
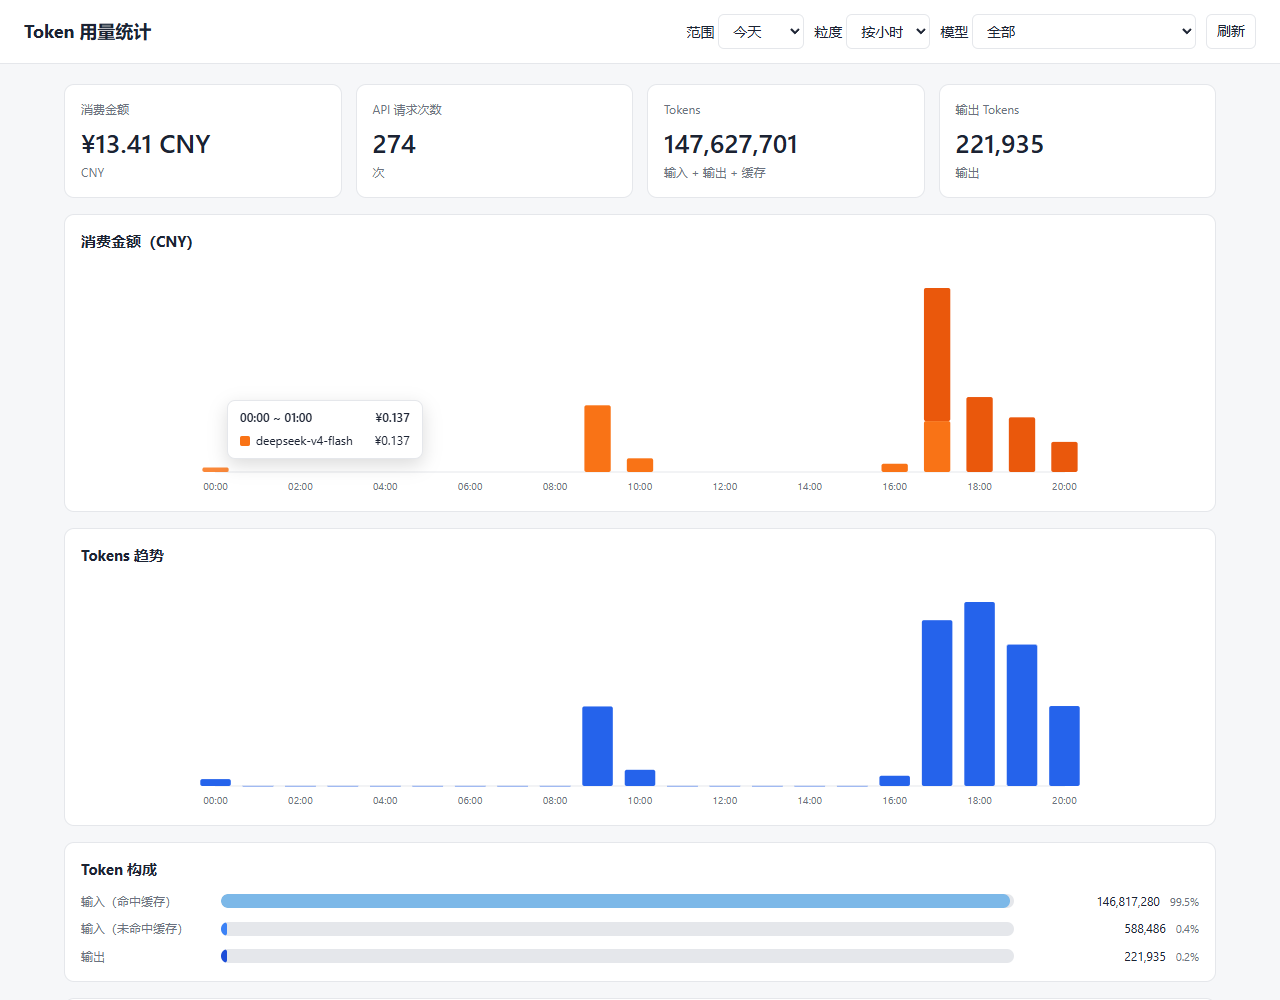
构成明细悬浮提示(悬停柱子查看分类明细)
全部范围 - 按天视图
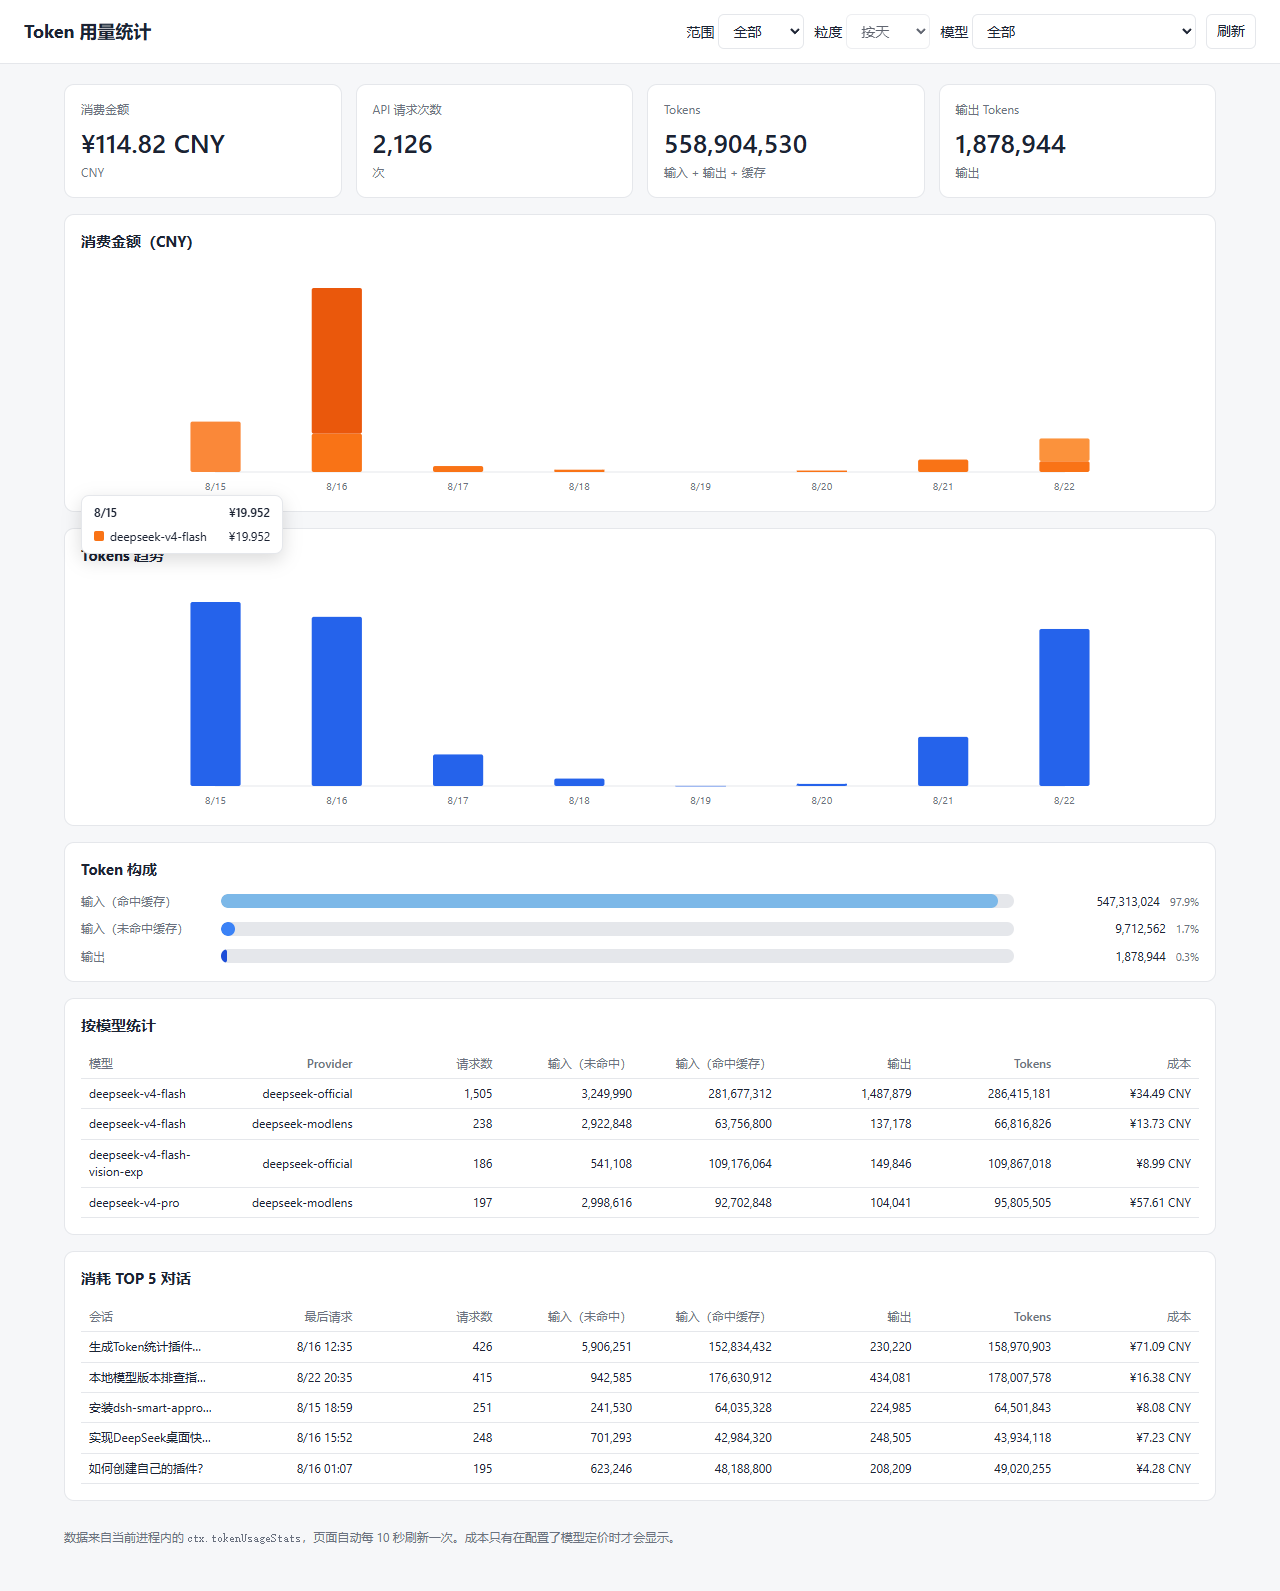
说明:目前仅统计 DeepSeek 官方 API 的费用(token 用量、请求次数与成本基于本地 Harness 会话日志回放),不包含其它提供商/渠道的 API 费用。
安装
dsh plugin --profile web add dsh-token-usage-stats@0.3.9
插件的 cordis.patch.yml 会插入插件行;浏览器半区通过 dsh.client 清单自动加载。安装后重启宿主(或刷新 GUI)。
更新到新版本:
dsh plugin --profile web add dsh-token-usage-stats@latest
使用
从侧边栏底部入口打开仪表盘,或直接访问 http://<host>:<port>/token-usage-stats。
页面默认显示「今天」的按小时视图,可切换 今天 / 近 3 天 / 近 7 天 / 近 30 天 / 全部 范围,其中「近 7 天」、「近 30 天」和「全部」显示按天视图(「全部」在跨度较长时会自动按自然周或自然月折叠展示,确保图表清晰不拥挤)。每 10 秒自动刷新一次。仅当配置了模型定价时才显示成本金额。
配置
插入行支持 config.currency(成本显示货币)与 config.pricing(各模型每百万 token 的价格)。成本按高峰/闲时两档计价:高峰为北京时间 09:00-12:00、14:00-18:00,其余北京时段为闲时;周末(北京时间周六/周日)全天按闲时。用 peak/offpeak 两档的模型按使用时间取对应档位;只用四个平档键(uncachedInputPerMillion / cacheReadPerMillion / cacheWritePerMillion / outputPerMillion)的模型任意时段同价。默认行带 currency: CNY,以及 deepseek-v4-flash / deepseek-v4-pro / deepseek-v4-flash-vision-exp 的高峰/闲时定价。
在 profile 自己的 cordis.patch.yml 中覆盖示例:
- patch:
    - id: token-usage-stats
      config:
        currency: USD
        pricing:
          deepseek-v4-flash:
            peak:
              uncachedInputPerMillion: 3.0
              cacheReadPerMillion: 0.10
              cacheWritePerMillion: 0
              outputPerMillion: 9.0
            offpeak:
              uncachedInputPerMillion: 1.5
              cacheReadPerMillion: 0.05
              cacheWritePerMillion: 0
              outputPerMillion: 4.5
开发
pnpm install   # devDependencies 通过 link: 指向本地 deepseek-harness checkout
pnpm run build # tsc -> lib/types, tsdown -> lib/index.js + lib/client.js
devDependencies 通过 link: 条目解析 @deepseek-ai/dsh-* 的类型,要求 harness checkout 位于本包上一级目录 ../deepseek-harness。运行时 peer 依赖由 dsh 宿主提供,不从 npm 安装。
发布
npm run build
npm publish    # 自动执行 prepublishOnly(npm run build)
仓库与反馈
- npm:https://www.npmjs.com/package/dsh-token-usage-stats
- 源码:https://github.com/jkStars/dsh-token-usage-stats
欢迎提 Issue 或 PR。
No comments yet. Be the first to write one.