dsh-mathmatic-symbol


English | 中文
The npm package name is
@jaxzhou/dsh-mathmatic-symbol.
A DeepSeek Harness plugin that
gives the agent four tools: typeset LaTeX into an image, draw a
mathematical figure from a declarative spec, and convert a formula or SVG
into an image ready to drop into a document. Every artifact is a
font-free SVG — each glyph is an outline <path> — plus an optional PNG,
returned together with Markdown / HTML / LaTeX snippets.
The plugin also registers prompt guidance that tells the model when to reach for it — an image or a document file is the deliverable, or the user asks for one — and not to hand-write SVG, LaTeX-rendering, or plotting code instead. In a session with this plugin installed, producing a formula image, a geometric figure, or a document containing them is a tool call, not a coding exercise.
dsh plugin --profile web add @jaxzhou/dsh-mathmatic-symbol
dsh --profile web
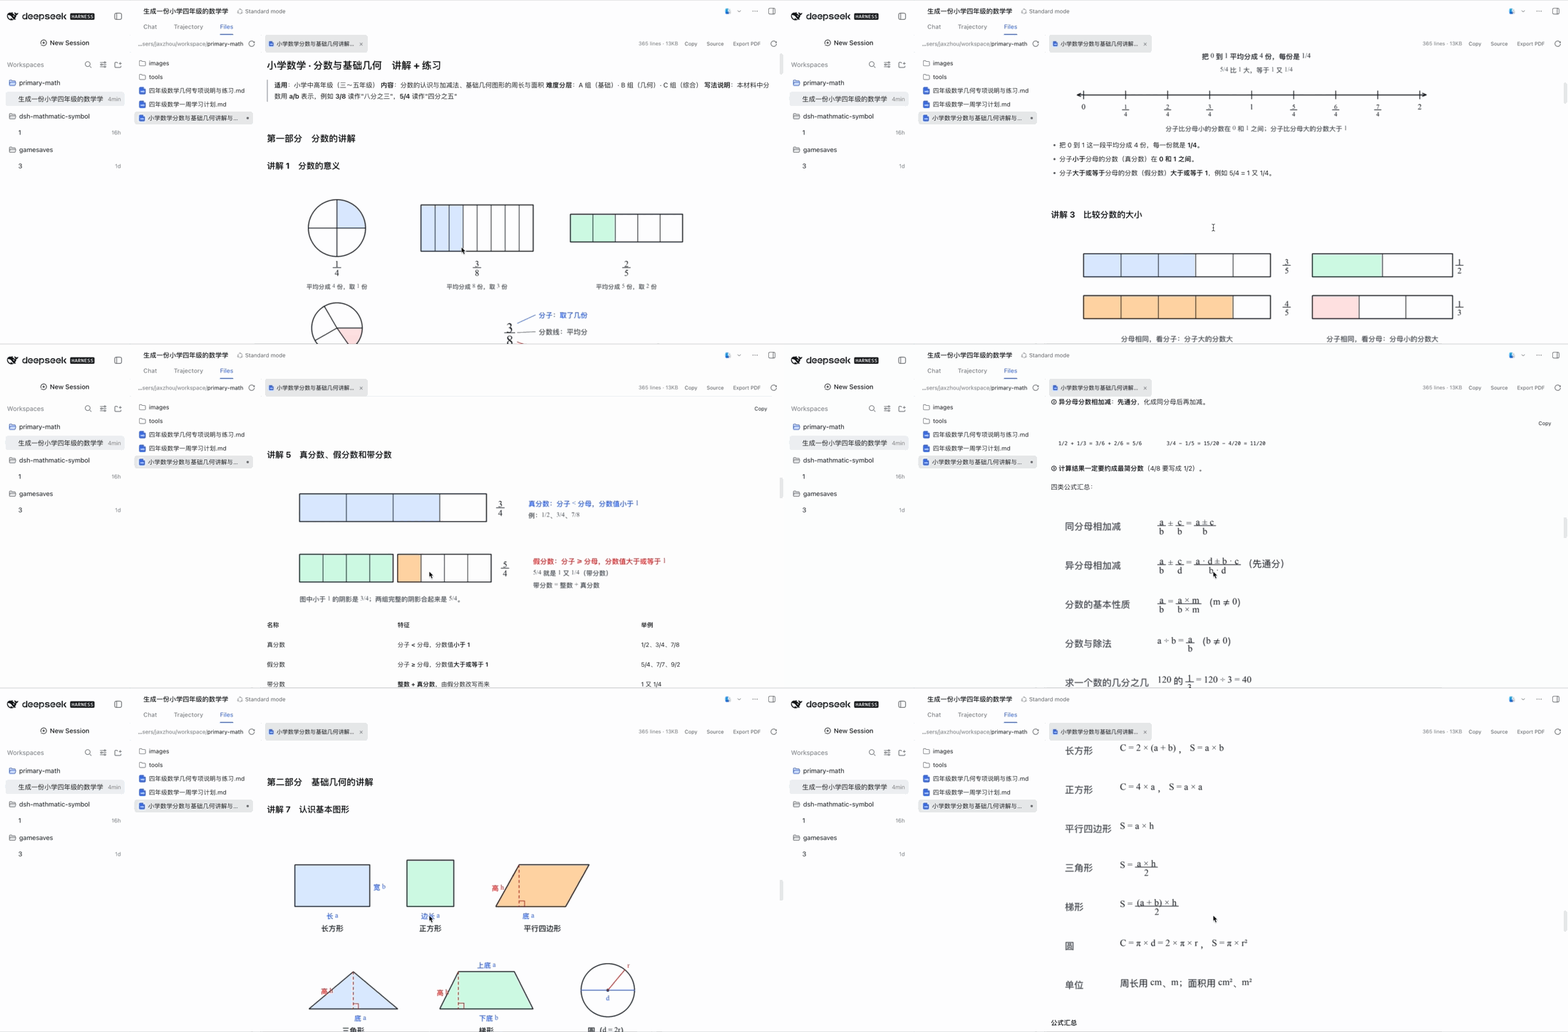
A 14-second screen recording of the plugin in a live session — click through for the full-quality video (3358×1480 H.264).
Below, a still the plugin produced — no fonts, no external tools:
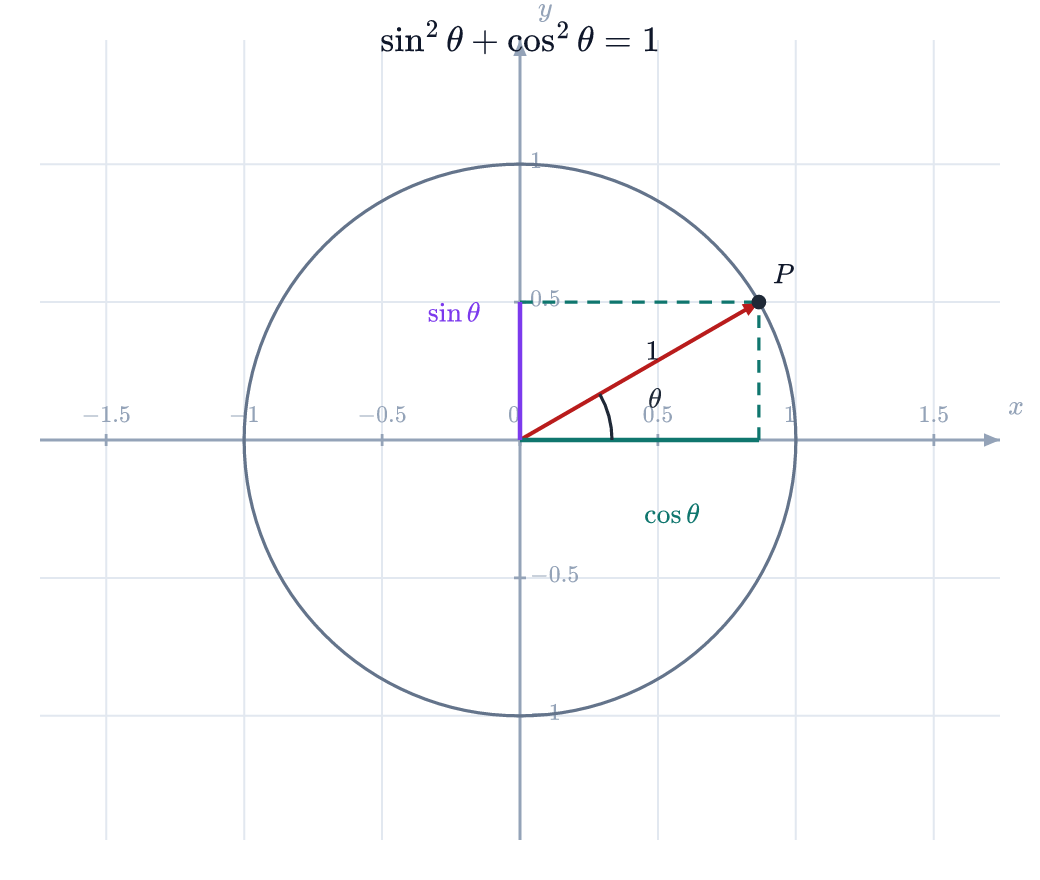
math_figure from examples/unit-circle.json — unit circle,
$\sin\theta$/$\cos\theta$ projections, angle arc and LaTeX title. Nothing in this
image depends on an installed font.
Contents
- Why images instead of text
- Quick start
- When the agent reaches for these tools
- The four tools ·
math_formula·math_figure·math_convert·math_document - Figure spec reference
- Coordinate expressions
- Documents with formulas and figures inserted
- Output: paths, naming, layout
- Embedding into documents
- Inline preview
- Configuration · Disable and uninstall
- Requirements and verification
- Privacy and authority
- Known limitations
- Development
Why images instead of text
A formula in a chat message is text; in a report, slide, Word file, or PDF it usually has to be a picture. Producing that picture reliably is the whole point of this plugin:
- No font dependency. MathJax runs with
fontCache: 'none', so every glyph becomes an outline path. The SVG contains no<defs>,<use>,id, orfont-family: it renders identically in a browser, in Word, in an\includegraphicspipeline, and on a build machine with no math fonts installed. - Deterministic rasters. PNG output comes from
@resvg/resvg-jswith system font loading disabled — the same bytes on every machine. - Content-addressed files. The same input always writes the same file name, so re-running a call overwrites instead of littering the workspace.
- Document-shaped output. Every call returns
embed.markdown_svg,embed.html_png,embed.latex_png, and optional base64 data URIs.
The trade-off is deliberate: because text is outlined, labels are not selectable or searchable inside the image.
Quick start
A formula. math_formula takes bare TeX; $…$, $$…$$, \[…\], \(…\),
and \begin{equation}…\end{equation} are stripped for you.
math_formula({ latex: "\\int_0^\\infty e^{-x^2}\\,dx = \\frac{\\sqrt{\\pi}}{2}" })
→ writes math/formula-f091edca9660.svg and math/formula-f091edca9660.png, and
returns paths, sizes and snippets (the alt text is abbreviated here):
<math kind="formula" display="true" width="148" height="55">
svg: math/formula-f091edca9660.svg (7.4 KiB, 148x55 at 1x)
png: math/formula-f091edca9660.png (8.5 KiB, 592x220)
markdown: 
html: <img src="math/formula-f091edca9660.svg" width="148" height="55" alt="…">
latex: \includegraphics[width=3.92cm]{math/formula-f091edca9660.png}
</math>
Snippets place both formats at the 1× display size (148 px), so the 4× PNG is a high-density asset for the same layout box rather than a 4× larger picture.
A figure. math_figure takes a JSON spec in mathematical coordinates, with
named points and LaTeX labels:
math_figure({ figure: { …see examples/triangle.json… }, name: "triangle" })
The spec behind the example above lives in
examples/triangle.json; a right triangle with a
right-angle marker, an angle label, grid and axes:
{
  "width": 420, "height": 320,
  "xRange": [-1, 5], "yRange": [-1, 4],
  "axes": true, "grid": true, "aspect": "equal",
  "vars": { "a": 3, "b": "2 * a" },
  "elements": [
    { "type": "polygon", "points": [[0, 0], [4, 0], [0, "a"]], "fill": "#93c5fd", "fill_opacity": 0.25 },
    { "type": "point", "at": [0, 0], "label": "A", "label_offset": [-14, 12] },
    { "type": "point", "at": [4, 0], "label": "B", "label_offset": [14, 12] },
    { "type": "point", "at": [0, "a"], "label": "C", "label_offset": [-14, -12] },
    { "type": "segment", "from": "A", "to": "B", "label": "c", "label_offset": [0, 14] },
    { "type": "angle", "at": "B", "from": "A", "to": "C", "label": "\\beta" },
    { "type": "angle", "at": "A", "from": "B", "to": "C", "right": true }
  ]
}
More specs you can render as-is: examples/unit-circle.json,
examples/rose.json (a three-petal polar rose),
examples/function-plot.json (a stretch-aspect
function plot).
A document. math_document renders the formulas and figures and inserts them
for you — no paths to invent, no markup to splice:
math_document({
  path: "docs/report.md",
  body: "# Area of a disc\n\nThe area is $A=\\pi r^2$ for radius $r$.\n\n$$A = \\int_0^1 2\\pi r\\,dr$$\n\n[[figure:triangle]]\n",
  math: "image",
  figures: { triangle: { /* a math_figure spec */ } }
})
→ writes docs/report.md plus docs/report-assets/*.svg|png, referencing each
image relative to the document:
<document format="markdown" path="docs/report.md" bytes="262" math="image" self_contained="false">
assets: docs/report-assets (4 images)
  $A=\pi r^2$ → docs/report-assets/formula-83490f278b73.svg (73x32)
  $r$ → docs/report-assets/formula-86965ab96917.svg (32x32)
  $$A = \int_0^1 2\pi r\,dr$$ → docs/report-assets/formula-65e3b2edd39f.svg (118x56)
  [[figure:triangle]] → docs/report-assets/triangle-7f4ecb6f5507.svg (300x240)
</document>
Conversion. math_convert handles what the others do not: an existing
SVG string, or an SVG/PNG file already in the workspace.
math_convert({ source: { path: "diagrams/flow.svg" }, format: "png", scale: 3 })
Foreign SVG is sanitized first — scripts, foreign markup, event handlers,
DOCTYPE, external references, remote paint servers and fetching styles are
removed, and every removal is reported in warnings.
Try it without a Harness
The drawing layer is an ordinary library call, so a spec can be previewed from a source checkout:
npm install
node scripts/render-example.mjs examples/rose.json          # writes .tmp/examples/rose.{svg,png}
node scripts/render-example.mjs examples/triangle.json out --scale=2
When the agent reaches for these tools
Tool descriptions say what a tool can do; they do not stop a model from writing its
own SVG, shelling out to a plotting library, or inventing image paths. So the plugin
also registers one ordered system-prompt section (tool:math-symbol, at the
TOOL_REPORT position) that states the trigger and the boundary:
Math and figures: when a formula or a geometric/function figure is needed as an image, or a document with such images embedded is the deliverable (or the user asks for one), use these tools rather than writing your own rendering code … Every call writes the image files into the session workspace, names them content-addressed, and returns paths plus ready-to-paste Markdown/HTML/LaTeX snippets — use what the tool returns; do not re-derive paths, re-encode images, or re-implement the rendering with SVG, LaTeX tooling, or a plotting library. Ordinary chat answers keep using LaTeX text directly; these tools are for image or document deliverables.
Two properties matter:
- On demand, not always. An answer that merely mentions a formula still uses LaTeX text; the tools appear when an image or a document file is the deliverable.
- Self-collapsing. The section resolves the visible tools on every assembly and returns an empty string when none are in scope, so hiding the tools also hides the instruction to use them.
It is registered through ctx.inject(['systemPrompt'], …): a composition without a
system prompt still gets the tools, it just loses the steering text.
The four tools
| Tool | What it does | Typical request |
|---|---|---|
math_formula |
LaTeX math → SVG + PNG image files | "turn this formula into an image for my doc" |
math_figure |
Declarative geometry/function figure → SVG + PNG | "draw a unit circle / triangle / rose curve" |
math_convert |
Formula, inline SVG, or workspace SVG/PNG → embeddable images | "convert this SVG to PNG" |
math_document |
Markdown/HTML/LaTeX document with formulas and figures already rendered and inserted | "write this up as a document with the diagrams in it" |
All four share the common parameters and return a structured result.
math_formula
| Parameter | Type | Default | Notes |
|---|---|---|---|
latex |
string, required | — | TeX math. Surrounding delimiters are tolerated and stripped. Max 20 000 characters. |
display |
boolean | true |
Display style (limits under operators, full-size fractions) vs inline style. |
font_size |
number | config fontSize (16) |
Pixels per em; 6–96. |
color |
string | config color (#000000) |
Flat CSS color: #111827, navy, rgb(17,24,39). |
| common | format, scale, background, padding, path, name, data_uri, preview. |
A TeX error never throws: MathJax's error marker is drawn into the image and the result carries a warning.
math_figure
| Parameter | Type | Default | Notes |
|---|---|---|---|
figure |
object, required | — | The figure spec. |
| common | as above (a spec-level background/padding wins over the parameter). |
math_convert
| Parameter | Type | Default | Notes |
|---|---|---|---|
source |
object, required | — | Exactly one of {latex, display?}, {svg}, or {path} (.svg or .png). |
font_size |
number | config fontSize (16) |
Only for a latex source. |
color |
string | config color |
Only for a latex source. |
| common | as above. |
A PNG source is passed through as-is (no re-encode): the result points at the existing file and returns embed snippets for it.
math_document
| Parameter | Type | Default | Notes |
|---|---|---|---|
path |
string, required | — | Workspace-relative document path. The format extension is appended when missing and must match format when present. |
body |
string, required | — | Body in the chosen syntax, with $…$, $$…$$, \$ and [[figure:name]] tokens. |
format |
markdown | html | latex |
markdown |
Syntax and output extension. |
title |
string | — | HTML <title>; a prepended # heading for Markdown (when the body has none); a \section* for LaTeX. |
math |
native | image |
native |
native leaves formulas as markup; image replaces every formula with a rendered image. |
image_format |
svg | png | both |
both |
Markdown/HTML reference SVG; LaTeX references PNG. |
figures |
object | {} |
Map of placeholder name → math_figure spec. Only referenced figures are rendered. |
assets_dir |
string | <document name>-assets beside the document |
Where the generated images go. |
self_contained |
boolean | false |
Inline images as base64 data URIs for one self-sufficient file; writes no asset files, and is not available for LaTeX. |
scale, background, color, font_size |
plugin config | Image options for the generated assets. | |
mathjax |
boolean | true |
For HTML with math: "native": include a MathJax CDN bootstrap so $…$ typesets. |
Common parameters
| Parameter | Type | Default | Notes |
|---|---|---|---|
format |
svg | png | both |
both |
svg needs no rasterizer. |
scale |
number | config scale (4) |
PNG zoom; 0.25–16. Pixel size = CSS size × scale. |
background |
string | config background (transparent) |
transparent or a flat color; applied to PNG and SVG alike. |
padding |
integer | config padding (8) |
Transparent margin in pixels at 1×; 0–128. |
path |
string | math/ + content hash |
A file (.svg/.png) or a directory, workspace-relative. |
name |
string | content hash | Human-readable base name; sanitized to [A-Za-z0-9._-]. |
data_uri |
boolean | config dataUri (false) |
Also return data:image/…;base64,… strings. |
preview |
boolean | config preview (false) |
Also attach the PNG to the result when the model accepts images. |
Unknown arguments are refused with the list of supported ones; a typo is never silently ignored.
Figure spec reference
Top-level fields of the figure object:
| Field | Type | Default | Notes |
|---|---|---|---|
width, height |
integer | 480, 360 |
Canvas in pixels; 40–4000. |
padding |
integer | the padding parameter (8) |
Transparent margin around the drawing. |
background |
string | the background parameter |
transparent or a flat color. |
xRange, yRange |
[min, max] |
auto-fit from the elements | Explicit ranges win; auto-fit adds a 6 % margin. |
aspect |
equal | stretch |
equal |
equal keeps circles circular (it widens the narrower range, like matplotlib's adjustable="datalim"); stretch fills the canvas — use it for wide function plots. |
vars |
object | {} |
Named numbers; values may be expressions over earlier names, e.g. {"a": 3, "b": "2 * a"}. |
grid |
true | {step?, color?} |
off | Grid lines at a "nice" step when step is omitted. |
axes |
true | {color?, labels?} |
on for curve/parametric/polar, else off |
Axis lines with ticks, tick labels, and x/y labels. |
title |
string (LaTeX) | — | Drawn top-center. |
elements |
array, required | — | At most 200 elements, evaluated in order. |
Elements
A point is either [x, y] — numbers or expression strings — or a string naming
an earlier point element's label, which is how "the median from A" stays
readable. Points may only reference points defined before them.
| Element | Fields |
|---|---|
point |
at, label (LaTeX), label_offset (screen px, y down; default [10,-10]), label_size (14), size (3), color, open |
segment |
from, to, style (solid/dashed/dotted), arrow (none/end/start/both), color, width (1.6), label, label_offset, label_size |
vector |
segment with arrow defaulting to end |
line |
through (exactly two points), extend (both/forward/backward/none), plus the segment stroke/label fields |
ray |
from, through (one point each), arrow (default end) |
polyline / polygon |
points, closed (false / true), fill, fill_opacity (0.18), style, arrow, label |
circle |
center with radius or through; fill, fill_opacity, style, color, width |
arc |
center, radius, start, end (degrees, counter-clockwise), arrow |
angle |
at, from, to, radius (px, default 30), right (square marker), label, label_size |
curve |
y (expression in x), domain (default [-5,5]), samples (400) |
parametric |
x, y (expressions in t), range (default [0, 2π]), samples |
polar |
r (expression in theta), range (default [0, 2π]), samples |
text |
at, text (LaTeX), size (14), color, anchor (start/middle/end), valign (baseline/middle/top/bottom), rotate |
Notes that save a round trip:
- Every label is LaTeX — in math mode. Write
A_1,\alpha,\frac{\pi}{2}; use\text{…}for upright words. label_offsetis in screen pixels, x right and y down.angleandarcangles are degrees and positive angles run counter-clockwise in mathematical orientation;polar/parametricranges are in radians.fillexpects an opaque or alpha-hex color (#93c5fd33);fill_opacityis the escape hatch when you prefer to keep the color plain.- Curves are split at the viewport edge instead of being clipped, so a pole like
tan(x)breaks the line rather than drawing a fake vertical segment. - Out-of-domain samples (
ln(x)forx ≤ 0) are skipped and counted in a warning.
Coordinate expressions
Every coordinate and every curve definition may be an expression. The evaluator
is a hand-written recursive-descent compiler — model-authored text is never
eval-ed — with a source-length cap and a 64-level nesting cap.
- Operators:
+ - * / % ^(right-associative), parentheses, unary minus. - Implicit multiplication:
2x,3sin(x),2(x+1),x y. - Constants:
pi(orπ),tau,e,phi. - Functions:
sin cos tan asin acos atan atan2 sinh cosh tanh asinh acosh atanh sqrt cbrt abs exp ln log log2 log10 floor ceil round trunc sign min max pow hypot mod gcd cot sec csc. - Backslashes are tolerated:
\sin(\pi/2)works. - Curve variables:
x(cartesian),t(parametric),theta/θ(polar). - Unknown variables, unknown functions, wrong arity, and over-deep nesting are hard errors naming the offender.
Documents with formulas and figures inserted
math_document is the "give me the file" tool. Three things make it more than a
concatenation:
- References are relative to the document. An asset written to
docs/report-assets/is referenced asreport-assets/…fromdocs/report.md, so the pair can be moved or committed together. - Insertion is format-correct. Markdown gets
; HTML gets<img … width height alt>with inline math baseline-aligned throughvertical-align; LaTeX gets\includegraphics[width=…cm]— wrapped in a centered environment for display math and figures, and raised by its ink depth (\raisebox) for inline math, so formulas sit on the baseline instead of floating. - Self-contained is one flag.
self_contained: trueinlines every image as a base64 data URI and writes no asset files: one file you can paste into a ticket or open from anywhere. (LaTeX is refused, because\includegraphicsneeds a file.)
math: "native" is the default and the lighter choice: formulas stay as markup for
the renderer to typeset, and only figures become images. Choose math: "image" when
the target cannot typeset math — Word, a plain-text pipeline, PDF conversion — or
when the user asks for formula images. For HTML with native math the wrapper
includes a MathJax CDN bootstrap (disable with mathjax: false to supply your own).
Nothing is dropped silently: a [[figure:name]] without a matching spec is a hard
error listing the names you provided, and a provided-but-unreferenced figure is
reported as a warning. Two details about the placeholder: the double-brace spelling
shipped in 0.1.1 is still accepted as an input alias (though it never appears in
prompt text, where the Harness reserves {{name}} for variable interpolation), and
the name may contain letters, digits, _ and - — anything else stays literal.
Output: paths, naming, layout
<session workspace>/
└── math/                             # configurable via outputDir
    ├── formula-1f0c9a2b3c4d.svg      # content hash of the formula + options
    ├── formula-1f0c9a2b3c4d.png
    ├── triangle.svg                  # when a `name` is given
    └── triangle.png
- Relative paths are resolved against the calling session's working directory, and a path that escapes it — including through a symlinked ancestor — is refused.
- Files are written atomically (temporary sibling + rename).
- The result reports both
svg_path(workspace-relative, for documents) andsvg_host_path(absolute, for other tools), plus byte counts and both CSS and pixel dimensions.
Embedding into documents
| Field | Shape | Use it for |
|---|---|---|
embed.markdown_svg / embed.markdown_png |
 |
GitHub, docs sites, most Markdown renderers (SVG stays crisp). |
embed.html_svg / embed.html_png |
<img src="…" width="…" height="…" alt="…"> |
HTML with explicit layout dimensions. |
embed.latex_svg / embed.latex_png |
\includegraphics[width=…cm]{…} |
LaTeX (the SVG variant needs the svg package or a raster fallback). |
data_uri_svg / data_uri_png |
data:image/…;base64,… |
Documents that cannot reference a sibling file; requires data_uri: true. |
Formats that were not produced are empty strings, never stale content.
Inline preview
With preview: true, the PNG is also attached to the tool result as a durable
image block, so a Web session can show it inline. This happens only when the
active model declares image input and the deployment mounts a durable
attachment store; otherwise the call degrades to a warnings entry such as
inline preview unavailable: model "…" does not declare image input. It is
never an error, and the files are always written regardless.
Configuration
Write it into the profile's cordis.patch.yml (applied after every bundle
layer):
- id: jaxzhou-mathmatic-symbol
  config:
    outputDir: math        # asset directory, workspace-relative
    scale: 4               # default PNG zoom
    color: '#000000'       # default formula ink
    background: transparent
    padding: 8
    fontSize: 16           # pixels per em for formulas
    preview: false         # default inline preview
    dataUri: false         # default data-URI output
    # workspaceRoot: /abs/path   # host-side override, mainly for tests
Invalid configuration fails at mount time with the offending field named; nothing is clamped or ignored.
Disable and uninstall
Disable the tools without uninstalling (live profiles pick it up without a restart):
- id: jaxzhou-mathmatic-symbol
  disabled: true
dsh plugin --profile web remove @jaxzhou/dsh-mathmatic-symbol
Requirements and verification
- DeepSeek Harness
0.1.5-rc.2— Host-only plugin: any profile with the tool registry works,headless,tui,web, or a custom composition. No Web UI is required. - Node ≥ 22.19 (the range declared by the Harness).
- Runtime dependencies:
mathjax-full@^3.2.2(pure JS) and@resvg/resvg-js@^2.6.2(native, only for PNG).
What is verified in this repository:
npm run check: typecheck, bundle build with artifact-shape assertions, and the test suite — exact-pixel geometry assertions, document assembly per format, and end-to-end runs over the emitted files.- The installed Harness's own
assertSupportedJsonSchemaandvalidateJsonSchemaValueaccept all four output schemas and live canonical values. - A real boot of a
@deepseek-ai/dsh-base+ plugin profile lists all four tools in the live registry (29 tools total) and assembles thetool:math-symbolguidance section into the real system prompt. - Not verified: a model-driven tool call with a real LLM (no API key in the build environment). The tool layer, the schemas, and the prompt section are covered by the checks above.
Published state: 0.1.2 is the current release and ships all four tools plus the
prompt guidance. 0.1.0 predates math_document and that guidance and registers
only three tools, so install @jaxzhou/dsh-mathmatic-symbol@^0.1.1 (an unpinned
install already resolves to it).
Privacy and authority
- Writes only inside the workspace. Output paths are resolved against the session's working directory and checked against symlinked ancestors.
- No network. Typesetting, drawing and rasterizing are local; MathJax and resvg are dependencies, not services.
- No credentials, no session data. The only service the plugin touches is
the optional
ctx.attachments.saveImage()used bypreview. - No model-authored code is executed. Expressions go through the compiler in
src/expr.ts; LaTeX excludes thehtml/require/autoloadextensions; SVG accepted bymath_convertis sanitized and every removal is reported. - Degrades on purpose. Without a prebuilt rasterizer binding, the call still
returns SVG and says so in
warnings.
Known limitations
- Text is outlines. Labels are not selectable or searchable inside the image; that is the price of rendering without fonts.
math_convertPNG input is pass-through. Existing PNGs are not re-encoded, and JPEG/WebP/GIF dimensions are not parsed; file input accepts only.svgand.png.- PNG needs the native binding. Without a prebuilt
@resvg/resvg-jsfor the platform, only SVG output is available. aspect: "equal"adjusts the view. With both ranges given, the narrower axis is widened so the scale stays uniform, so axes may extend slightly past the ranges you asked for. Useaspect: "stretch"for a wide function plot.- One figure per call. No multi-panel/subplot syntax; draw several elements on one canvas or make several calls.
- No 3-D and no implicit curves. Planar explicit functions, parametric curves and polar curves only.
- Default output directory is
math/. Pointpathelsewhere, or setoutputDir, if you keep assets in a different tree. - Documents are generated whole.
math_documentwrites a complete file and overwrites it on re-run; there is no incremental edit, and hand-edits to a generated document are lost if you regenerate it. Use it to produce final output, not to maintain a living document. - Native math in HTML pulls a CDN script. The MathJax bootstrap is a
<script>from jsDelivr; usemathjax: falseto supply your own, ormath: "image"for a fully offline document. - Inline math images in Markdown sit on the baseline. Only HTML and LaTeX get
explicit baseline correction (
vertical-align,\raisebox); Markdown renderers decide image alignment themselves.
Release history
| Version | Released | Highlights |
|---|---|---|
0.1.2 |
2026-09-13 | Hotfix: the document tool's figure placeholder is now [[figure:name]]. The double-braced spelling shipped in 0.1.1 collided with system-prompt variable interpolation ({{name}} with a name outside [a-z][a-z0-9_]* throws), which broke every prompt assembly in a profile running the plugin; the old spelling is still accepted as an input alias, and the suite now checks all prompt-facing text against the Harness's own rules. |
0.1.1 |
2026-09-13 | math_document — documents with formulas and figures already rendered and inserted; the tool:math-symbol prompt guidance that keeps the agent calling these tools instead of hand-writing renderers; embed snippets now place the PNG at its 1× display size; four renderable specs in examples/ and a full reference in both READMEs. |
0.1.0 |
2026-09-12 | First release: math_formula, math_figure, math_convert, font-free SVG output, and the shared embed snippets. |
Development
Build, artifact model, dependency policy and the real-Harness verification steps are in CONTRIBUTING.md; repository rules are in AGENTS.md.
npm install
npm run check        # typecheck + build + tests
node scripts/render-example.mjs examples/rose.json
License
MIT — see LICENSE.
No comments yet. Be the first to write one.