dsh-top
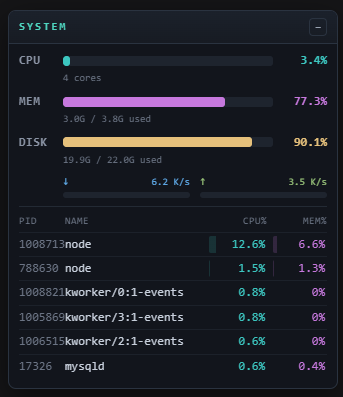
A plugin for the DeepSeek Harness (DSH) web GUI: a system monitoring tool that shows live system stats in a floating, collapsible panel pinned to the top-right corner.

Features
- CPU — live utilisation (computed from
os.cpus()tick deltas) + core count - MEM — used / total with percentage bar (from
os.totalmem()/os.freemem()) - DISK — used / total with percentage bar (platform-specific)
- NETWORK — download / upload throughput (platform-specific byte deltas)
- Top 6 processes — PID, name, CPU%, MEM% (platform-specific)
- Dark color-coded palette (cyan CPU, magenta RAM, yellow disk, blue/green network), monospace
- Draggable via the title bar, collapsible via the
–/+button - Transient monitor processes (
ps,awk,head, …) are filtered out of the top-processes list
How it works
| Part | File | What it does |
|---|---|---|
| Host half | lib/index.js |
Registers GET /api/dsh-top-stats; CPU + memory use Node os APIs with container-aware cgroup overrides; disk, network and processes use per-platform collectors that degrade to null when unavailable. |
| Browser half | lib/client.js |
dsh.client web bundle; registers the panel into the frame-wide shell.overlay slot; polls every 2 s (pauses while collapsed). |
| Composition | cordis.patch.yml |
The dsh.bundle patch layer that inserts the loader entry. |
Platform support
DSH host code runs on Linux, but the DSH server can be run on any OS Node.js supports. dsh-top is multi-platform: it always reports at least CPU + memory (Node os, no subprocess), and fills in disk / network / processes where the platform allows. Missing sections are shown as n/a in the widget rather than failing the whole request.
| Platform | CPU | MEM | DISK | NETWORK | PROCESSES |
|---|---|---|---|---|---|
| Linux | ✅ | ✅ | df |
/proc/net/dev |
ps |
| macOS | ✅ | ✅ | df |
netstat -ib |
ps (BSD) |
| Windows | ✅ | ✅ | PowerShell Get-PSDrive |
PowerShell Get-NetAdapterStatistics |
PowerShell Get-Process† |
| Containers (cgroup) | ✅* | ✅* | df* |
/proc/net/dev* |
ps* |
| Other / unknown | ✅ | ✅ | n/a | n/a | n/a |
† Windows process CPU is a lifetime-average percentage — Get-Process.CPU (cumulative CPU seconds) divided by process age, the same semantics Linux ps pcpu reports — and MEM% is derived from the real RSS bytes, not the raw working-set value. Every external collector (ps, df, powershell, …) runs with a 5 s timeout, so a wedged tool degrades its section to n/a instead of hanging the request.
* Container support is container-aware and graceful:
- Memory — when a cgroup memory limit is set (Docker
--memory, a Kubernetes limit, systemd unit limit), the MEM meter reports the container's limit and current usage (cgroup v2memory.max/memory.current, or v1memory.limit_in_bytes/usage_in_bytes) instead of the host's total. On an unlimited cgroup it falls back to the hostos.totalmem()view. - CPU cores — when the cgroup restricts CPU (v2
cpu.maxquota/period, or v1cpu.cfs_quota_us/period_us), the core count reflects the quota; otherwise it usesos.cpus().length. - Tightest ancestor wins, sentinels are safe — the limit files are read by walking our own cgroup path upward (not just the cgroup root), so a Docker limit under a host-level cap is reported correctly. Kernel-default sentinels are treated as "no limit": v2
max, v1 CFS-1, and the ~2^63 bytes v1memory.limit_in_bytesreports on an unrestricted root — so an unrestricted host is never misread as having exabyte-sized RAM. - Slim/distroless images that lack
df/psstill report CPU + memory; the missing DISK/NETWORK/PROCESSES sections render as n/a.
The CPU + memory meters work on every Node platform. Disk, network and process meters depend on the listed command/pseudo-file being present — otherwise those sections render as n/a while the rest keep working.
Testing
npm test
Runs a zero-dependency suite (node --test) over the pure collector parsers with realistic fixtures: Linux (df, /proc/net/dev, ps), macOS (netstat -ib, BSD ps), and Windows (PowerShell JSON output — including the CPU-seconds→percentage and RSS-bytes→percent conversions), plus the cgroup file parsers (memory.max, cpu.max, CFS quota, and the "no limit" sentinels) and the live container memory/CPU fallback contract. The macOS/Windows parsers are verified here without needing a live Mac or Windows machine — only the thin command-execution wrapper around them is platform-bound.
Security
Because it is a system monitor, the host half reads host-wide CPU, memory, disk, network and process state. The cross-platform core (CPU + memory) uses Node's built-in os module — no subprocess and no OS-specific pseudo-files. Linux /proc reads go through Node's own fs.readFileSync. Only the platform collectors that need system tools invoke them — ps, df, and on Windows powershell — every time via execFileSync with a static argv array (never a shell string, no shell -Command interpolation of untrusted data), so there is no shell-injection surface and no attacker-controlled input. On Windows the PowerShell sub-command is a fixed script literal; none of its values come from the HTTP request. No data leaves the host, no credentials are read, and every read is read-only.
dsh.so's static scanner flagsnode:child_processas "critical". That is a heuristic signal on the mere presence of process access — not a vulnerability. Process access is intrinsic to a monitoring tool; review the (small) source yourself: the collectors are platform-whitelisted, argument-confined, and read-only, and any failure degrades to "n/a" rather than failing the request.
Install
dsh plugin --profile web add dsh-top
Then restart the web app and refresh the page — the panel appears at the top-right.
No comments yet. Be the first to write one.