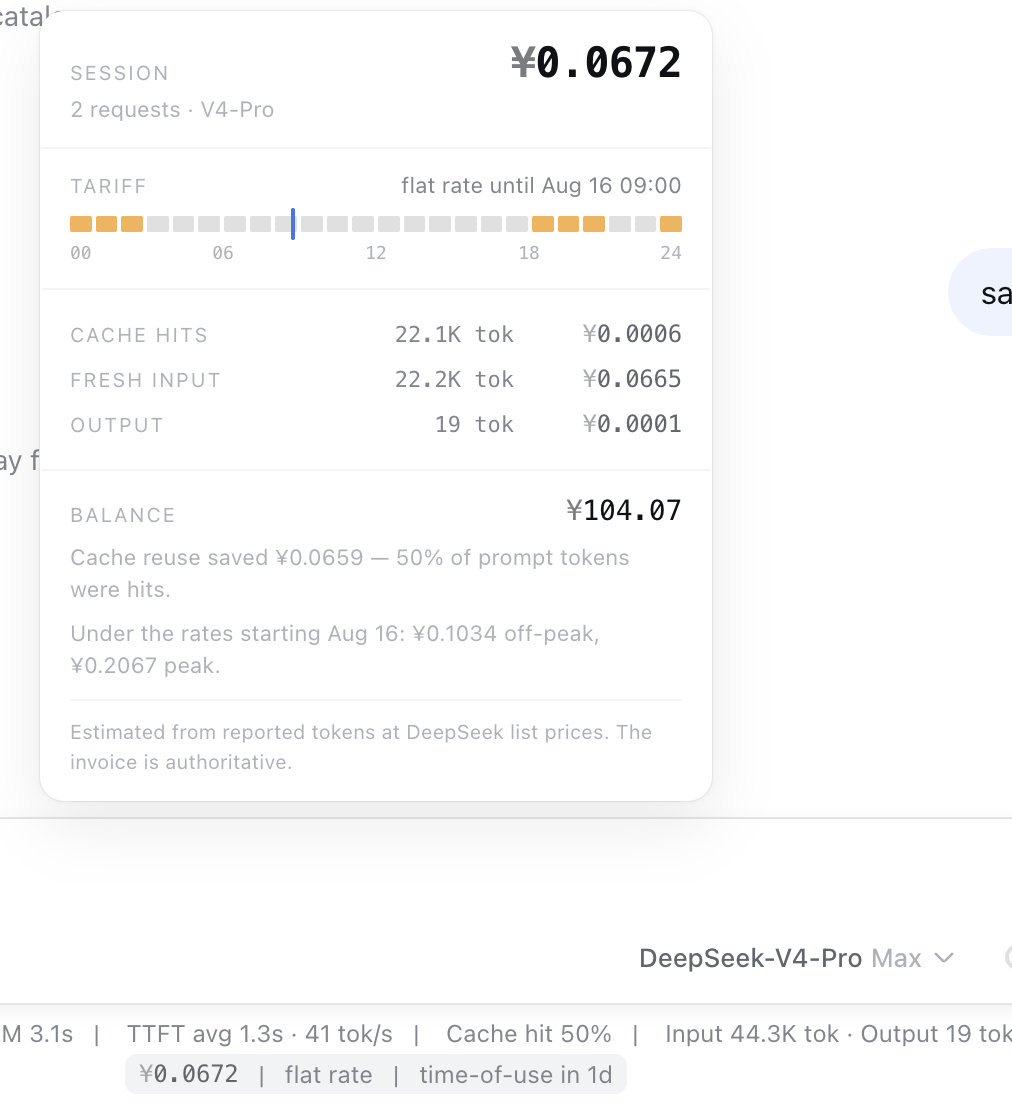
dsh-meterEnglish | 中文 DeepSeek bills by time of day now. This is the meter for it.Two peak windows a weekday, off-peak at half the peak rate — and since 22 August, off-peak all weekend. Cost stopped being a number you read afterwards and became a rate you are standing in. One line under the composer: what this session cost, which tariff is running, how long until it flips. Hover it for the tariff clock, the cache economics, and your balance.
|
 |




Install
dsh plugin --profile web add @dshworks/dsh-meter
dsh --profile web
dsh plugin forwards to pnpm, so pnpm must be on PATH. Nothing else to
configure: the meter appears under the composer as soon as a session bills
its first request.
The line
2 turns · 2 steps | LLM 3.1s | TTFT avg 1.3s · 41 tok/s | Cache hit 50% | Input 44.3K tok
                    ¥0.0672  |  peak  |  off-peak in 48m
The harness's own stats line, untouched, and ours under it. This plugin adds a line — it does not shadow the shipped one, which is what a cost plugin has to do to append to it.
Hover or focus for the card. Inside a peak window the tariff is called out in amber and the countdown runs to the next off-peak hour:
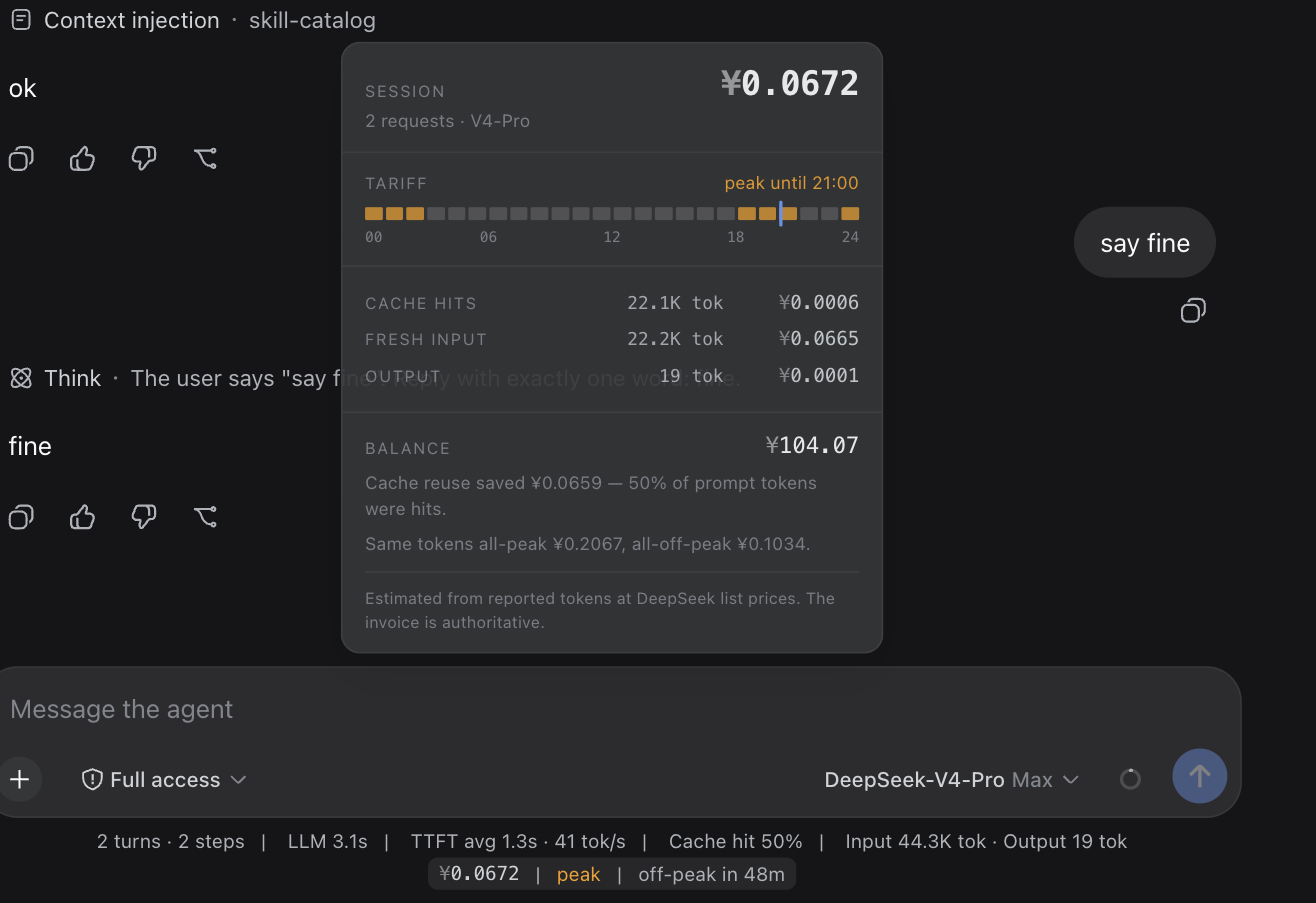
| The card shows | Why it is there |
|---|---|
| The session total, request count, models | The number, once, at full size |
| A 24-hour tariff strip in your local time, with a live now-marker | Peak windows are published in UTC and restricted to Beijing weekdays. Reading them off a strip beats doing timezone arithmetic at 11pm — and on a weekend the strip is empty, which is the answer |
| cache hits / fresh input / output — tokens and money on each | A cache hit costs 1/30th of a miss. This is the row that shows whether your prompt prefix is stable |
| Your account balance, and how much of it is granted credit | Granted balance expires; topped-up balance does not |
| The same tokens priced under the other tariff | Before the switchover: what the new rates do to this session. After: what waiting for off-peak is worth |
| What the cache saved | The counterfactual where every hit had been a miss |
Settings: the meter before you spend
The line needs a session, and a session that has already billed something — so the one question this plugin exists to answer was unaskable until after you had paid to ask it. Settings → Meter answers it cold.
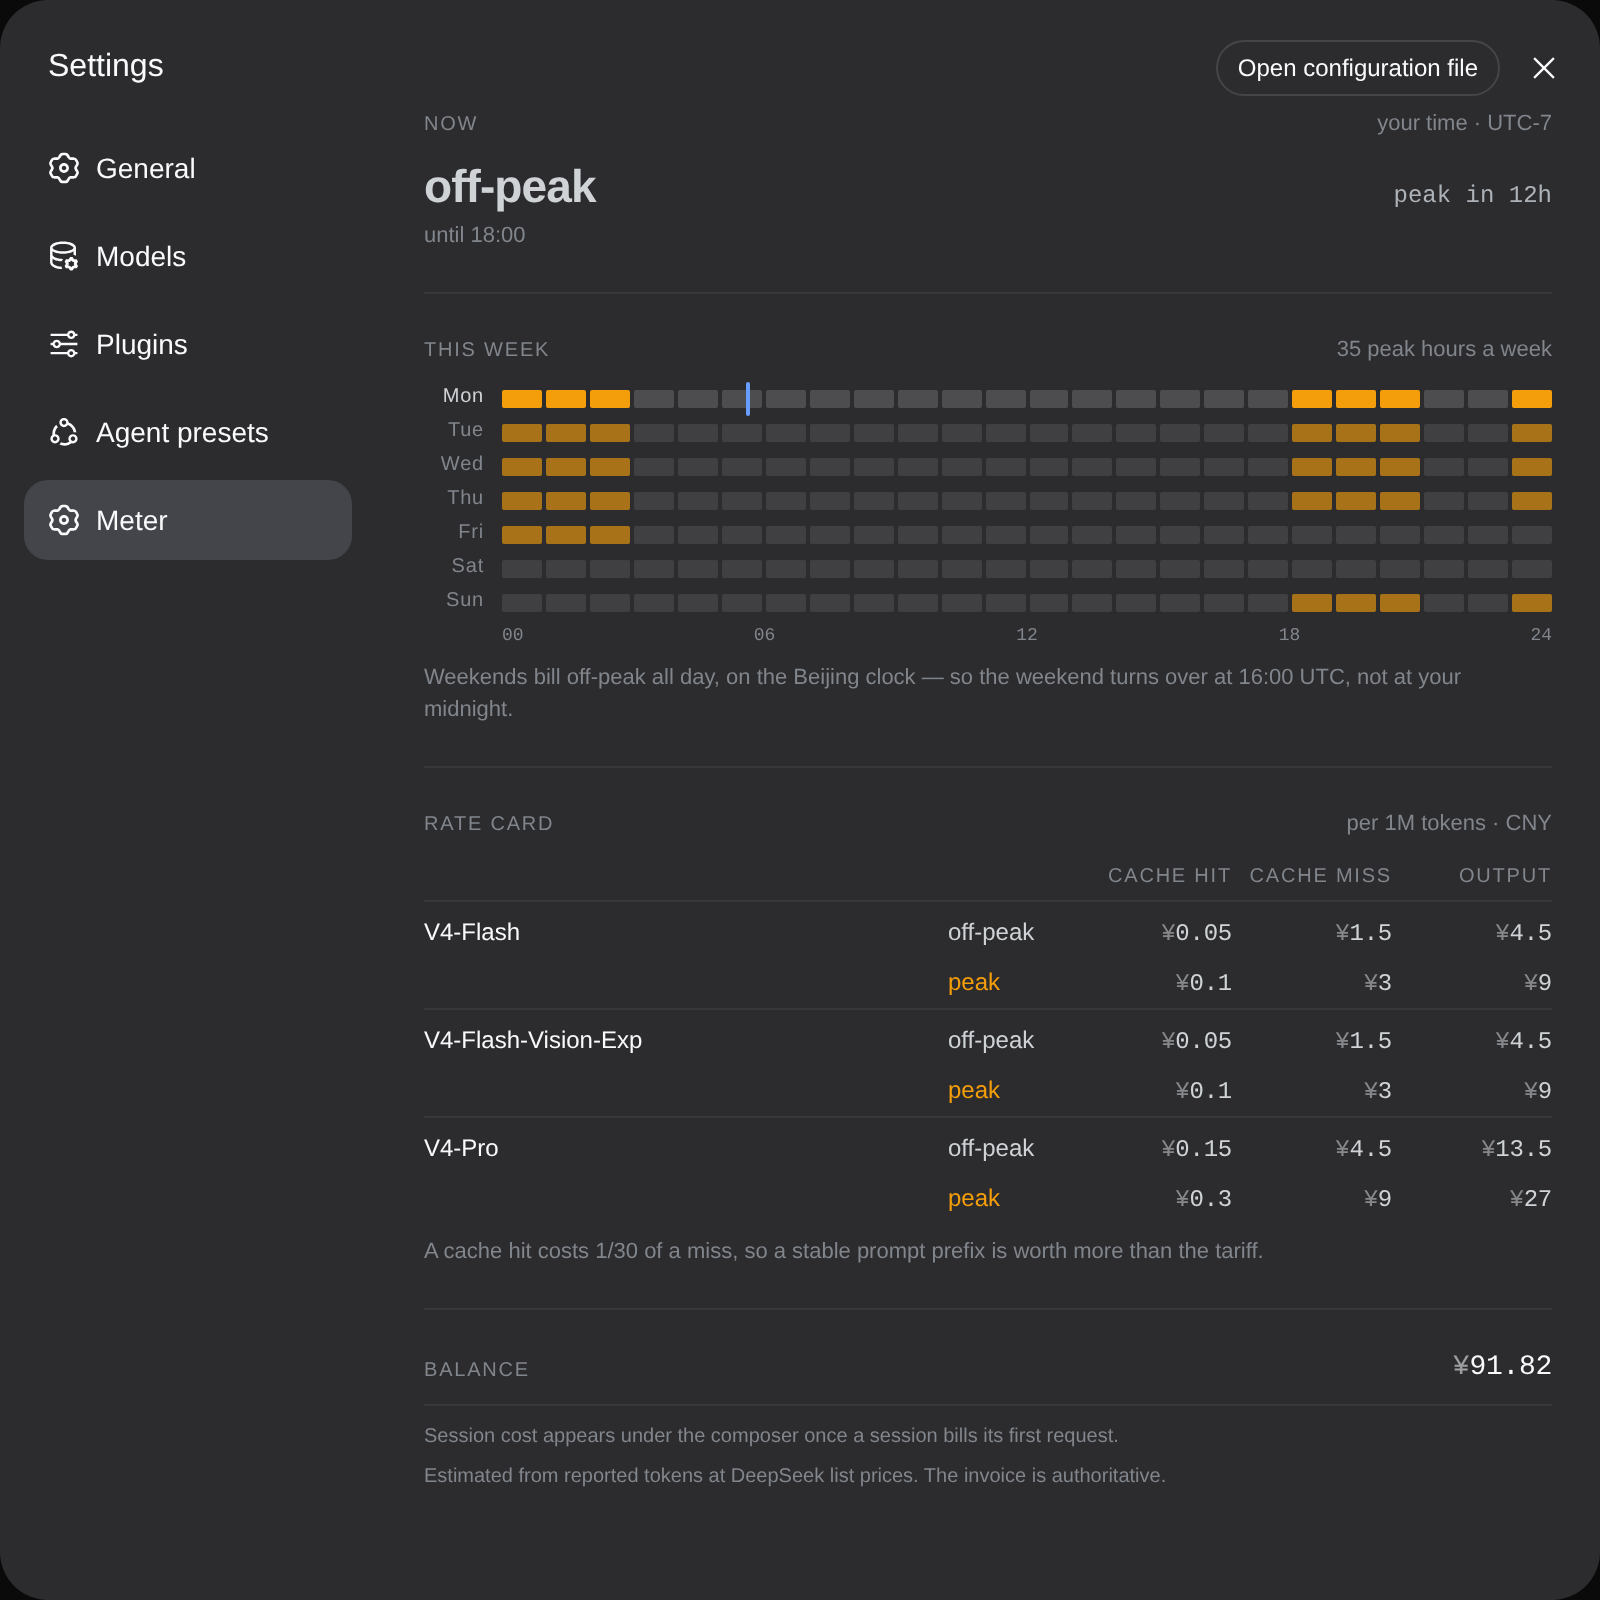
It is deliberately not a form. Both config knobs live in the plugin's own configuration, where the harness already edits plugin config; a second write path for two fields would be the settings-page reflex rather than the content. What is here is the instrument:
| The section shows | Why it is there |
|---|---|
| The tariff running now, at full size, with the countdown and the clock time it ends | The reason to open the panel, answered before you read anything else |
| The week — seven local days by twenty-four hours, peak in amber, a live now-marker | The card's strip answers "when does today change". Since weekends went off-peak this is a weekly question, and 35 amber cells out of 168 is the fastest way to see that peak is 35 hours a week, not 49 |
| The published rate card in the currency your account is billed in | At the precision DeepSeek publishes it — ¥1.5, not ¥1.50. A rate is a quotation, not a total |
| Your balance | Read once when the panel opens, through the same host route the card uses |
The grid is laid out in your days, not Beijing's, and every cell asks the same function that prices a request — so the picture and the bill cannot disagree while still sparing you the timezone arithmetic.
In Chinese the hour slots carry a small joke. Peak and valley — 峰 and 谷 — are the old words for time-of-use electricity, and the peak half is one character from the name of the man who founded the company selling the tokens. Hover a slot: 文峰, 文谷.
Proof
Live-verified against dsh 0.1.1-rc.2 on 2026-08-24, in a real web
session on DeepSeek-V4-Pro and V4-Flash — not a mock:
Re-run, because reading the source was not enough. Through rc.8 this note argued from a byte-identical
src/that the projection contract had not moved. It then moved:0.1.1-rc.1renamedschematostateSchemaand made the client-visibleviewan optionalwire. Because the registry reads the definition field by field and never validates it, the old spelling did not fail — it silently meant host-only, and the dock line rendered nothing on an otherwise healthy harness. A contract that degrades to silence cannot be checked by diffing its source; the table below is a fresh live run, not an argument.
| Claim | How it was checked |
|---|---|
| Loads in a stock web profile | dsh --profile web --dump-config lists @dshworks/dsh-meter; /plugins/@dshworks/dsh-meter/client.js serves 200 |
| The line renders | ¥0.2185 | off-peak | peak in 14h under the composer, read out of the live DOM — the check that would have caught the rc.1 rename |
| The readout is correct | 36.1K cache-miss input + 147 output across V4-Flash and V4-Pro = ¥0.2162 + ¥0.0023 = ¥0.2185, matching the harness's own token counts on the stats line directly above it |
| Survives a restart | Server restarted, an eight-day-old session reopened cold — the projection replays from the durable log at the same figure |
| The card opens | Per-model split, the cache counterfactual (all-peak ¥0.2185 vs all-off-peak ¥0.1093), and the account balance, with no page errors |
| Currency detection | A live account returns {"currency":"cny", ...} from /dsh-meter/balance and the whole surface switches to ¥ with no configuration |
| Both themes, both tariff states | Light and dark, flat and peak, captured above on 2026-08-15 — that run predates the 08-16 switchover, so its flat readout is one a new session no longer reaches |
| 130 tests, CI green | pnpm test — the fold, the tariff clock, the rate card, the saving-mode nudge, the balance reader, the registration contract against a stand-in registry of each era, and the generated-bundle sync check |
Two currencies, no conversion
DeepSeek publishes two independent rate cards — USD for the international platform, CNY for the mainland one. An account is billed against exactly one of them, and neither table is a conversion of the other, so a plugin that picks with an exchange rate is wrong twice.
dsh-meter computes both and lets the account decide. GET /user/balance returns the currency the account is denominated in — a
live account lists both rows with only one funded — so the meter reads
the funded row and shows that side. Nothing to configure, nothing to
guess from your interface language.
The balance request runs on the host, keyed by the same credential seam
the LLM adapter uses; the browser gets parsed numbers over
GET /dsh-meter/balance and never the key. It fires when the meter
mounts and when you open the card, not on a schedule — set
balance: false to turn the whole thing off and the meter keeps working.
The rate card
Carried verbatim in lib/core.js, per 1M tokens.
| cache hit | cache miss | output | |
|---|---|---|---|
| v4-flash off-peak | $0.007 / ¥0.05 | $0.22 / ¥1.5 | $0.66 / ¥4.5 |
| v4-flash peak | $0.014 / ¥0.10 | $0.44 / ¥3 | $1.32 / ¥9 |
| v4-flash-vision-exp off-peak | $0.007 / ¥0.05 | $0.22 / ¥1.5 | $0.66 / ¥4.5 |
| v4-flash-vision-exp peak | $0.014 / ¥0.10 | $0.44 / ¥3 | $1.32 / ¥9 |
| v4-pro off-peak | $0.022 / ¥0.15 | $0.66 / ¥4.5 | $1.98 / ¥13.5 |
| v4-pro peak | $0.044 / ¥0.30 | $1.32 / ¥9 | $3.96 / ¥27 |
Peak is 01:00–04:00 and 06:00–10:00 UTC, Monday to Friday (09:00–12:00 and 14:00–18:00 Beijing). Every other hour is off-peak, including the two-hour gap between the windows and the whole weekend. Off-peak is exactly half of peak — and still above the flat rate it replaced, by about 2.3x on output.
deepseek-v4-flash-vision-exp shipped 2026-08-21 and bills at exactly
the v4-flash rates in both currencies. Images are converted to tokens by
their dimensions and billed as input. It has no flat row: it arrived
after the switchover, so it has no pre-time-of-use history to reprice.
Weekends have been off-peak all day since 2026-08-22 16:00 UTC (00:00 Beijing, Sunday 23 August), on the Beijing calendar — so the weekend turns over at 16:00 UTC, not at midnight UTC. Peak is 35 hours a week, not 49. DeepSeek announced this only in the pricing-page footnote and only until it took effect; the live page now states just the settled rule, so the announcement survives at the archived page.
The retired flat card, kept to reprice historyBilled at every hour until 2026-08-16 16:00 UTC. Upstream no longer publishes it; the meter keeps it because a session logged before the switchover must still cost what it actually cost.
| cache hit | cache miss | output | |
|---|---|---|---|
| v4-flash flat | $0.0028 / ¥0.02 | $0.14 / ¥1 | $0.28 / ¥2 |
| v4-pro flat | $0.003625 / ¥0.025 | $0.435 / ¥3 | $0.87 / ¥6 |
Against it, pro rose 6x/12x on cached input, 1.5x/3x on cache-miss input and 2.3x/4.6x on output (off-peak/peak). The steepest rise is on the cheapest token, which is the one an agent sends most of.
Source: https://api-docs.deepseek.com/quick_start/pricing, diffed against both locales daily.
And checked against the bill, twice a week. A published table is what
a vendor says; a balance is what it does, and only one of those is what
you pay. scripts/verify-bill.mjs spends a known number of tokens, waits
for the charge to settle, and compares the balance delta against what this
card predicts. Measured 2026-09-09, peak, on a live account:
| model | tokens | card predicts | actually settled |
|---|---|---|---|
deepseek-v4-flash |
254,682 miss | ¥0.7641 | ¥0.77 |
deepseek-v4-pro |
127,491 miss | ¥1.1475 | ¥1.14 |
The two checks answer different questions, and the pair is the diagnosis:
| pricing page | the bill | what it means |
|---|---|---|
| ok | ok | the card is right |
| differs | ok | the page moved, billing has not — a pre-announcement |
| ok | differs | billing moved and the page did not |
| differs | differs | a repricing; the card needs updating |
Row three has no other detector. It also covers something that is not a
price change at all: a request served by a model other than the one asked
for, billed at that model's rate. The API's model response field is an
echo of the request — measured across every published id — so the name can
never be the evidence for that. The money can.
Measuring a balance is harder than it sounds, and the first version of this script looked right until it ran.
Settlement is delayed, and it arrives in steps. Two hand probes settled
as one lump about 145s after the requests, so v1 waited for two consecutive
equal balance reads. Its first real run reported deepseek-v4-pro billing
¥1.42/1M against a card of ¥9 — confident, alarming and false. The charge
had reached ¥0.02, then ¥0.04, and a plateau between two steps looks exactly
like a finished settlement if a plateau is all you check for. A delta is
settled only once it has not moved for longer than a whole settlement
takes, and a zero delta is never settled at all — for the first two
minutes a real charge reads as ¥0.00, which is indistinguishable from free.
A probe contaminates the next one. Settlement outlives a probe, so
probe N's tail lands inside probe N+1's window and is billed to the wrong
model. All models are now measured in one window against one summed
prediction; --isolate <model> re-probes a single one when something needs
localising.
"A bill can only be contaminated upwards" was wrong. v1 argued that other traffic on the key can only add, so a bill that looked too small needed no confirming. Incomplete settlement also makes a bill look small, and did. Both directions are re-probed now.
Settlement has a tail, and the tail was a 3% "mystery". A full curve, sampled every 20 seconds: ¥0.27 at t+40s, ¥0.26 at t+100s — then single cents at t+222s and t+749s, 500 seconds apart and still arriving twelve minutes in. About two cents a round land after anyone has stopped watching, which is precisely the ~3% by which every earlier reading fell short of the eventual charge. So the probe does not wait for the true total, because waiting for it never terminates: a cent is noise, a step is a step, and the alarm sits far above both. Every failure worth catching is enormous next to a few cents — a rerouted model is 3x, a wrong tariff column 2x, a mispriced cache bucket 30x.
This verifies the CNY card only. The balance is CNY; the USD table is published separately and there is no USD balance to read.
The card is also a feed
Building your own estimator? Take the card, not the numbers in this table.
https://dsh.works/dsh-meter/pricing.json
Static JSON, no key, no rate limit. Both currencies, both tariffs, the
weekly schedule, the retired flat card for repricing history, and the
bucket definitions — generated from lib/core.js by
scripts/build-feed.mjs, so it cannot
state a price the meter would not charge.
In JavaScript, skip the fetch and call the same module directly:
import { costOf, tariffAt } from '@dshworks/dsh-meter/core'

const tokens = { miss: 188_542, hit: 1_204_880, out: 9_310 }
costOf(tokens, 'deepseek-v4-pro', tariffAt(Date.now()), 'cny')
lib/core.js imports nothing. Rate card, tariff clock, and cost fold are
pure functions of their arguments — no clock reads inside, so history
reprices at the tariff it was actually billed under.
What does it cost right now?
The feed answers this without containing a "now". It publishes the week as a grid; you index it with the current Beijing weekday and hour. That is why a CDN can cache it for ten minutes, or you can vendor it into a binary, and it still cannot be stale about which tariff is running:
curl -s https://dsh.works/dsh-meter/pricing.json | jq -r '
  ((now + 8*3600) | gmtime) as $b
  | .timeOfUse.scheduleBeijing[$b[6]][$b[3]] as $t
  | "\($t) · v4-pro out $\(.models["deepseek-v4-pro"].rates[$t].usd.out)/1M"'
Shift by 8*3600 first, then break down once, and take both indices
off that same result: $b[6] is the day of week (0 = Sunday, as in
JavaScript) and $b[3] the hour. An endpoint that returned the answer
instead would be wrong for as long as its cache lives, on exactly the
boundary where being wrong costs 2x.
Three ways to get this wrong, all silent:
- Local hours.
scheduleBeijingis indexed on the vendor's clock and is not rotated into your timezone.new Date().getHours()returns a plausible tariff that is wrong for most of the planet. - Mixing the two clocks. Taking the weekday from your own calendar and the hour from Beijing's disagrees for the eight hours from 16:00 UTC, when Beijing is already on the next day. Derive both from one shifted instant.
- Broken-down time offsets. jq's
gmtimeis[year, month, day, hour, minute, second, weekday, yearday]— the hour is.[3]and the weekday.[6]. Writing.[2]reads the day of the month, which is a valid index into a 24-hour array. Testing this section at 09:59 UTC,.[2]saidoffpeakwhile the real tariff waspeak. It looked completely reasonable.
Reading @1's scheduleUtc now returns null: the key was removed
rather than deprecated, because a reader that kept using it would have
gone on labelling every weekend peak and overstating those sessions by
2x. See timeOfUse.changedInV2 in the feed.
The schedule is anchored to Beijing (UTC+8), and China has not observed
daylight saving since 1991 — that fixed offset is the only reason a
table of UTC hours is safe to publish at all. The feed states it under
timeOfUse.anchor, and verify-pricing checks the English page's UTC
sentence and the Chinese page's Beijing sentence separately, then
checks that they still agree.
One caveat no feed can fix: now is your machine's clock. If it has
drifted, so has your tariff.
Why not use an existing price feed? Because none of them are right. Checked 2026-08-20, four days after the switchover, both of the sources an estimator usually reaches for still published DeepSeek's retired flat card as current:
| Source | v4-pro cache-miss input | Understates the real bill by |
|---|---|---|
| models.dev | $0.435 | 1.5x off-peak, 3.0x peak |
| LiteLLM | $0.435 | 1.5x off-peak, 3.0x peak |
| this feed | $0.66 off-peak / $1.32 peak | — |
On cached input, the bucket an agent sends most of, models.dev is off by 12x at peak. And this is not a staleness bug they can patch: both schemas hold one flat price per model per bucket, with nowhere to put a tariff. A number that is wrong for seven hours of every weekday cannot be represented correctly in either.
OpenRouter's /api/v1/models is accurate, but for a different question —
it quotes what OpenRouter charges to resell the model, not what DeepSeek
bills your account.
Nobody types these numbers
Not us, and ideally not you. A hand-maintained rate card rots, and the
vendor is the proof: DeepSeek's own pi integration guide
ships a cost block where v4-flash's cache-read rate is a 10x decimal
slip (0.028 for a rate of 0.0028) and the v4-pro figures are exactly
4x the card — they are Azure's resale prices, pasted into DeepSeek's
documentation, on a page people copy into their agent config.
So the card is written by machine and reviewed by human:
| read | scripts/verify-pricing.mjs |
scrapes both locales — prices, peak windows, model list — and diffs them against the card |
| write | scripts/apply-pricing.mjs |
splices the scraped values back into lib/core.js, then re-runs the verifier against its own output and reverts if that second read disagrees |
| ship | npm run build |
regenerates the bundle, the site and the feed from the rewritten card |
| judge | you | the job opens a PR; it never merges one |
A daily job runs all four. Locally
it is npm run verify:pricing to look and npm run sync:pricing to
rewrite.
Why it opens a PR instead of merging. Every invariant CI can check is structural — off-peak is half of peak, output costs more than a cache miss, a live request never prices at the retired card — and a wrong-but-plausible parse satisfies all of them. No test can tell a right price from a believable one. A human looking at a diff can.
The last price change arrived with no announcement in any channel we watch. That is the argument for the alarm; the vendor's own 10x typo is the argument for taking the keyboard away from all of us.
How the money is counted
| Behavior | Detail |
|---|---|
| Source of truth | Provider-reported token counts in the durable session log. Nothing is sampled or inferred |
| Tariff per request | Decided by dispatch time (step/start), not by when the answer finished. A request sent at 00:59 UTC is billed off-peak even if it streams into the peak window, and a session that spans a boundary is billed correctly on both sides |
| Billed buckets | inputTokens at the cache-MISS rate, cacheReadTokens at the cache-HIT rate, outputTokens at the output rate. The harness reports these disjoint (the DeepSeek adapter subtracts hits out of prompt_tokens), and reasoning tokens are already inside output |
| Cache writes | Folded into the miss bucket. DeepSeek publishes no separate write price and bills a first-time prompt at the miss rate; the DeepSeek adapter never reports one |
| Failed requests | A step's usage chunk is counted even when the request then fails; the finalized message REPLACES that sample rather than adding to it, including when the message names a different model than the request header did |
| Unknown models | Counted and named, never priced. A model with no published rate contributes tokens and requests to the readout and zero money, and the card says so |
| Durability | One session projection (costMeter), folded from the log. It survives paging, compaction, a reload, and a server restart, and rides the standard projection cache |
Model Experience
None by default. dsh-meter adds no tool, no system-prompt section, no
message, and no model call; it does not touch the request. Cost belongs
to the person paying, not to the agent's context window. The one opt-in
exception is saving mode
(savingMode: true): one system-prompt section that names the tariff in
force, absent entirely when its text renders empty.
KV Cache effect
None by default. In saving mode, the meter:tariff section's text is
byte-identical inside a tariff window, so the prompt prefix — and its
cache — hold from one request to the next; the section changes only at
the tariff boundaries, so the first request after a flip misses the
prefix cache, and then holds again.
Configuration
Everything below is a validated config field, set in your profile's
cordis.patch.yml:
- id: dsh-meter
  config:
    currency: cny        # pin a rate card instead of detecting it
    balance: false       # never call /user/balance
    savingMode: true     # tell the model which tariff it is standing in
| Key | Default | Meaning |
|---|---|---|
currency |
auto |
Which rate card to show: auto (the account's own balance currency, then the interface language), usd, or cny |
balance |
true |
Serve the account balance to the Web UI |
apiKeyEnv |
DEEPSEEK_API_KEY |
Credential reference holding the API key |
baseUrl |
https://api.deepseek.com |
Origin the balance is read from |
balanceTtlMs |
300000 |
Minimum age before a card opening refetches the balance |
balanceTimeoutMs |
4000 |
Per-request timeout for the balance read |
savingMode |
false |
Contribute a system-prompt section naming the tariff in force, so the model can behave accordingly |
savingPeakPrompt |
the built-in nudge | Text injected while a peak window runs |
savingOffPeakPrompt |
'' |
Text injected while no peak window runs; empty (the default) means the section renders to nothing and costs zero prompt tokens |
Saving mode — the meter talks back
Off by default, because a readout should never grow into the agent's
context window on its own. Flip savingMode: true and the meter stops
being a bystander: at every assembly it contributes one system-prompt
section, meter:tariff, that tells the model which tariff the next
request will be dispatched under and how to behave in it.
Inside a peak window the section carries savingPeakPrompt — by default
the meter's own nudge: the peak hours are named, the doubling of the
bill is stated, and the model is asked to answer concisely, prefer
context it already has over new tool calls, and offer to defer expensive
work until the window closes. Outside the windows the section renders
savingOffPeakPrompt; empty by default, so the meter's voice costs
zero tokens when there is nothing to warn about. Want the model to
loosen up off-peak instead? Set savingOffPeakPrompt to something like
"off-peak, the half-price hours are running — you may be liberal with
tokens".
Four properties are deliberate:
- The tariff is read at assembly time, from the same clock the billing fold uses. The nudge and the bill can never disagree about which side of a boundary the next request lands on — including weekends, which bill off-peak all day and therefore get no nudge at all.
- The hours in the nudge are derived, not typed.
peakHoursPhrase()reads them offPEAK_WINDOWS_UTCandtariffSchedule(), so a schedule change rewrites the sentence. A prompt that tells a model the wrong peak hours is a plugin lying to it about money. - The text is constant inside a tariff window. A countdown in here would change every minute and roll the session's prompt-prefix cache for one sentence's sake — the most expensive way to save money this plugin can think of. The section flips only at tariff boundaries (first request after a flip misses the prefix cache), and then holds.
- It is a nudge, not a throttle. The model may ignore it; nothing is enforced at the request layer. If you need a hard cap, that is a different plugin.
Development
pnpm install
pnpm test                        # generated-artifact checks, then vitest
pnpm run build                   # regenerate all three artifacts after editing core/ui
pnpm run verify:pricing          # diff the card against DeepSeek's own pages (network)
lib/core.js holds the rate card, the tariff clock, and the fold.
lib/balance.js is the account reader. src/ui.js is the browser
surface. Three artifacts are generated from that one card —
lib/client.js (the bundle the harness serves), docs/index.html (the
site) and docs/pricing.json (the feed) — so the price table exists in
exactly one file, and pnpm test fails if any of them drifts from it.
verify:pricing is the only script that touches the network, and it is
deliberately outside pnpm test: a unit suite must not fail because a
documentation site is slow, and a price alarm must not stay silent
because nobody opened a PR this week. It runs on its own daily schedule.
Known limitations
- It is an estimate, not the invoice. List prices times reported tokens. Promotional pricing and any relay in front of the API are invisible to it.
- Tariff is inferred from the dispatch timestamp, which is the harness's clock. A request DeepSeek receives on the far side of a boundary can bill differently by a second or two.
- Non-DeepSeek routes are not priced. Their tokens are counted and their model named; the card reports them as unpriced instead of quietly applying DeepSeek's rates to someone else's API.
- The rate card is compiled in. DeepSeek changes prices; this plugin ships the time-of-use card as re-checked on 2026-08-17 and needs a release to follow the next change.
- Web only. The projection is available to any surface, but the readout is built for the Web UI. There is no TUI line.
Prior art
The dsh registry lists ~50 cost and usage
plugins;
several arrived the same week DeepSeek dated the switchover, and reading
them shaped this one. The cache-savings framing comes from
deepseek-cli's local
usage ledger.
License
MIT. Not affiliated with DeepSeek. "DeepSeek Harness" is DeepSeek's trademark, used here only to say what this works with; the name follows the "DSH" form their brand guidelines recommend.
No comments yet. Be the first to write one.