dsh-nexus-usage-panel
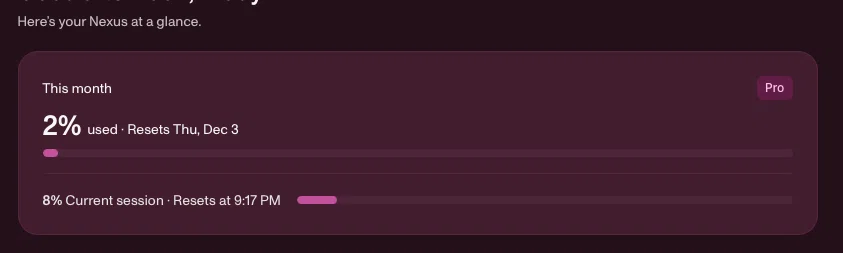
Nexus usage dashboard panel for the DeepSeek Harness (DSH) Web GUI. It mirrors the Fireworks Nexus desktop app's Overview card — plan tier badge, "This month — N% used · Resets ", and "N% Current session · Resets at
How it works
The panel reads the same private REST API that nexus.fireworks.ai and the Nexus desktop app read — see docs/research-api.md for the full endpoint map:
| Endpoint | Purpose |
|---|---|
GET /v1/accounts/{account}/nexusPlans |
Active plan tier + billing period |
GET /v1/accounts/{account}/users/{user}/nexusPlanUsage |
monthly and 5-hour rollingWindow usage percents + reset times |
POST /v1/accounts/{account}/usageCosts:query |
(Milestone 2) per-day, per-model spend — lags the meters with billing attribution |
POST /v1/accounts/{account}/usageSavings:query |
(Milestone 2) live per-day spend, estimated savings + cache-hit rate |
Auth uses the per-machine key the Nexus desktop app minted at sign-in, stored in the macOS login keychain (service FireworksAI, account fireworks-api-key). The key never leaves the host process; the browser only ever sees sanitized percentages. Overrides: FIREWORKS_NEXUS_KEY env or the plugin's apiKey config; gateway override via NEXUS_GATEWAY_URL / gatewayBase config.
Note: nexusPlanUsage exposes percentages of your plan limits only — but the savings endpoint does return dollar spend to a member key (see docs/milestone-2-schema.md). Per-model spend arrives only through usageCosts:query, whose attribution lags the meters (INCOMPLETE, no rows early in a period): while it's pending, the panel shows an attribution-pending note plus a live daily-spend trend read from the savings pipeline, and widens the model query to the last 30 days so prior-period rows display as soon as they're attributed. DSH sessions themselves run through Nexus Auto (api.fireworks.ai/inference/v1, model auto); Fireworks routes server-side and does not echo the routed model id to the client.
The daily-spend trend renders as a GitHub-style contribution grid (Sunday-aligned weeks, month labels, Nexus-pink heat levels, Less→More legend) by default, with branded hover tooltips on each day (Tue, Nov 3 · $4.25, "no spend" for gaps); the ▦/☰ picker on the section header switches to a per-day table. The choice is a host-side setting persisted at ~/.dsh/nexus-usage-panel.json and served from GET/POST /api/dsh-nexus-usage/config ({"spendStyle": "grid" | "table"}, anything else falls back to grid).
Install
# In a DSH profile (or via the Plugins page):
pnpm add dsh-nexus-usage-panel
Or in the DSH Web GUI: Plugins → Install, spec dsh-nexus-usage-panel. Then reload; open Settings → Nexus Usage.
From GitHub without npm: Plugins → Install with spec
github:bradywatkinson/dsh-nexus-usage-panel.
Via the experimental Discover tab (custom plugin markets): add index source
https://raw.githubusercontent.com/bradywatkinson/dsh-nexus-usage-panel/main/market/index.json
and install Nexus Usage from the card. The index is format-1, validated with @deepseek-ai/dsh-plugin-market-index.
- macOS only for the keychain read (the Nexus desktop app must be signed in once).
- One gateway read per minute (cached); each of plan/seat fails independently, like the app.
Development
npm test # host shaping + client smoke
Repo layout: lib/index.js (host: cordis plugin, serves /api/dsh-nexus-usage/usage), lib/client.js (browser module: the dashboard card in the settings.section slot), cordis.patch.yml (bundle row).
Roadmap
- Issues: https://github.com/bradywatkinson/dsh-nexus-usage-panel/issues
- Milestone 2 (#3): per-model/token breakdown via
usageCosts:query— model rows render as soon as attribution completes; until then the panel shows live spend + savings. Token-level detail is not exposed by any verified endpoint.
License
MIT
No comments yet. Be the first to write one.