Inline Visuals
English · 简体中文
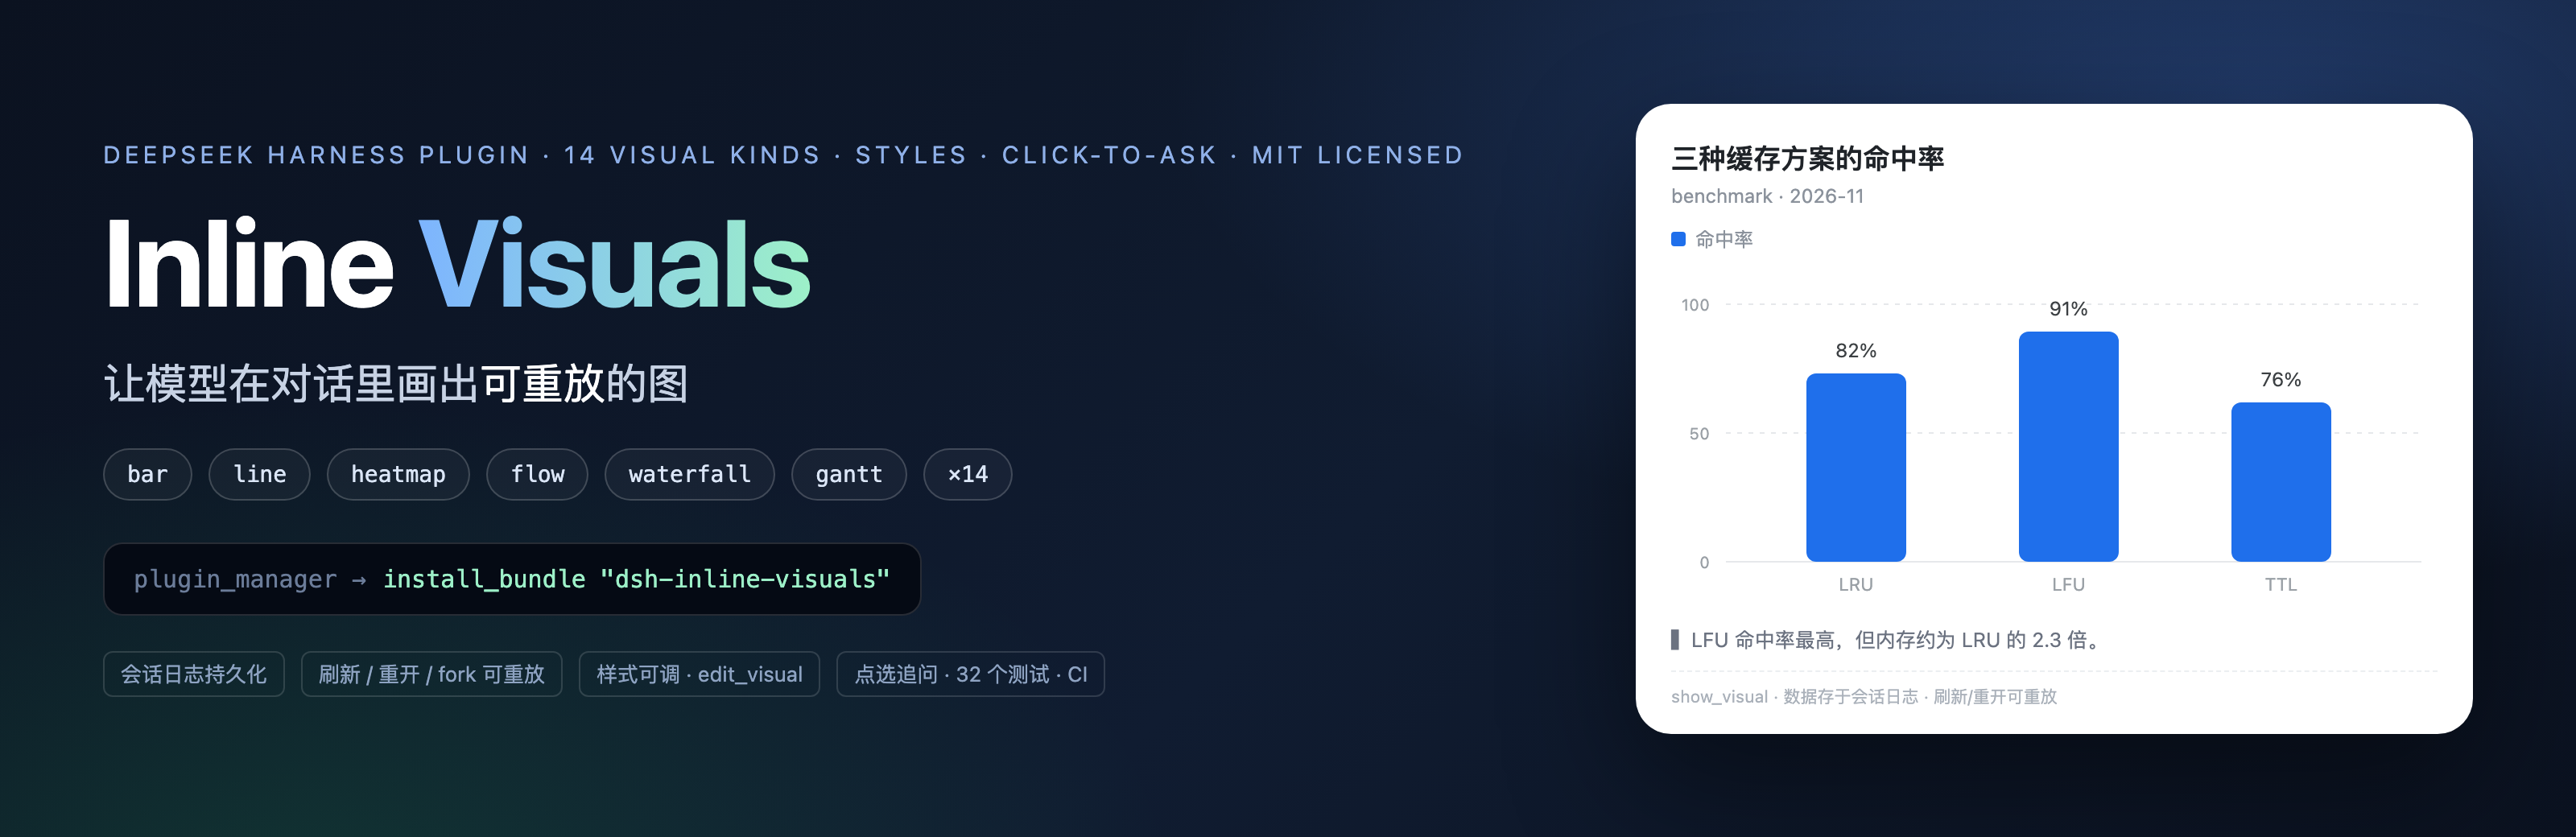
Charts your agent can draw — and your session can replay.
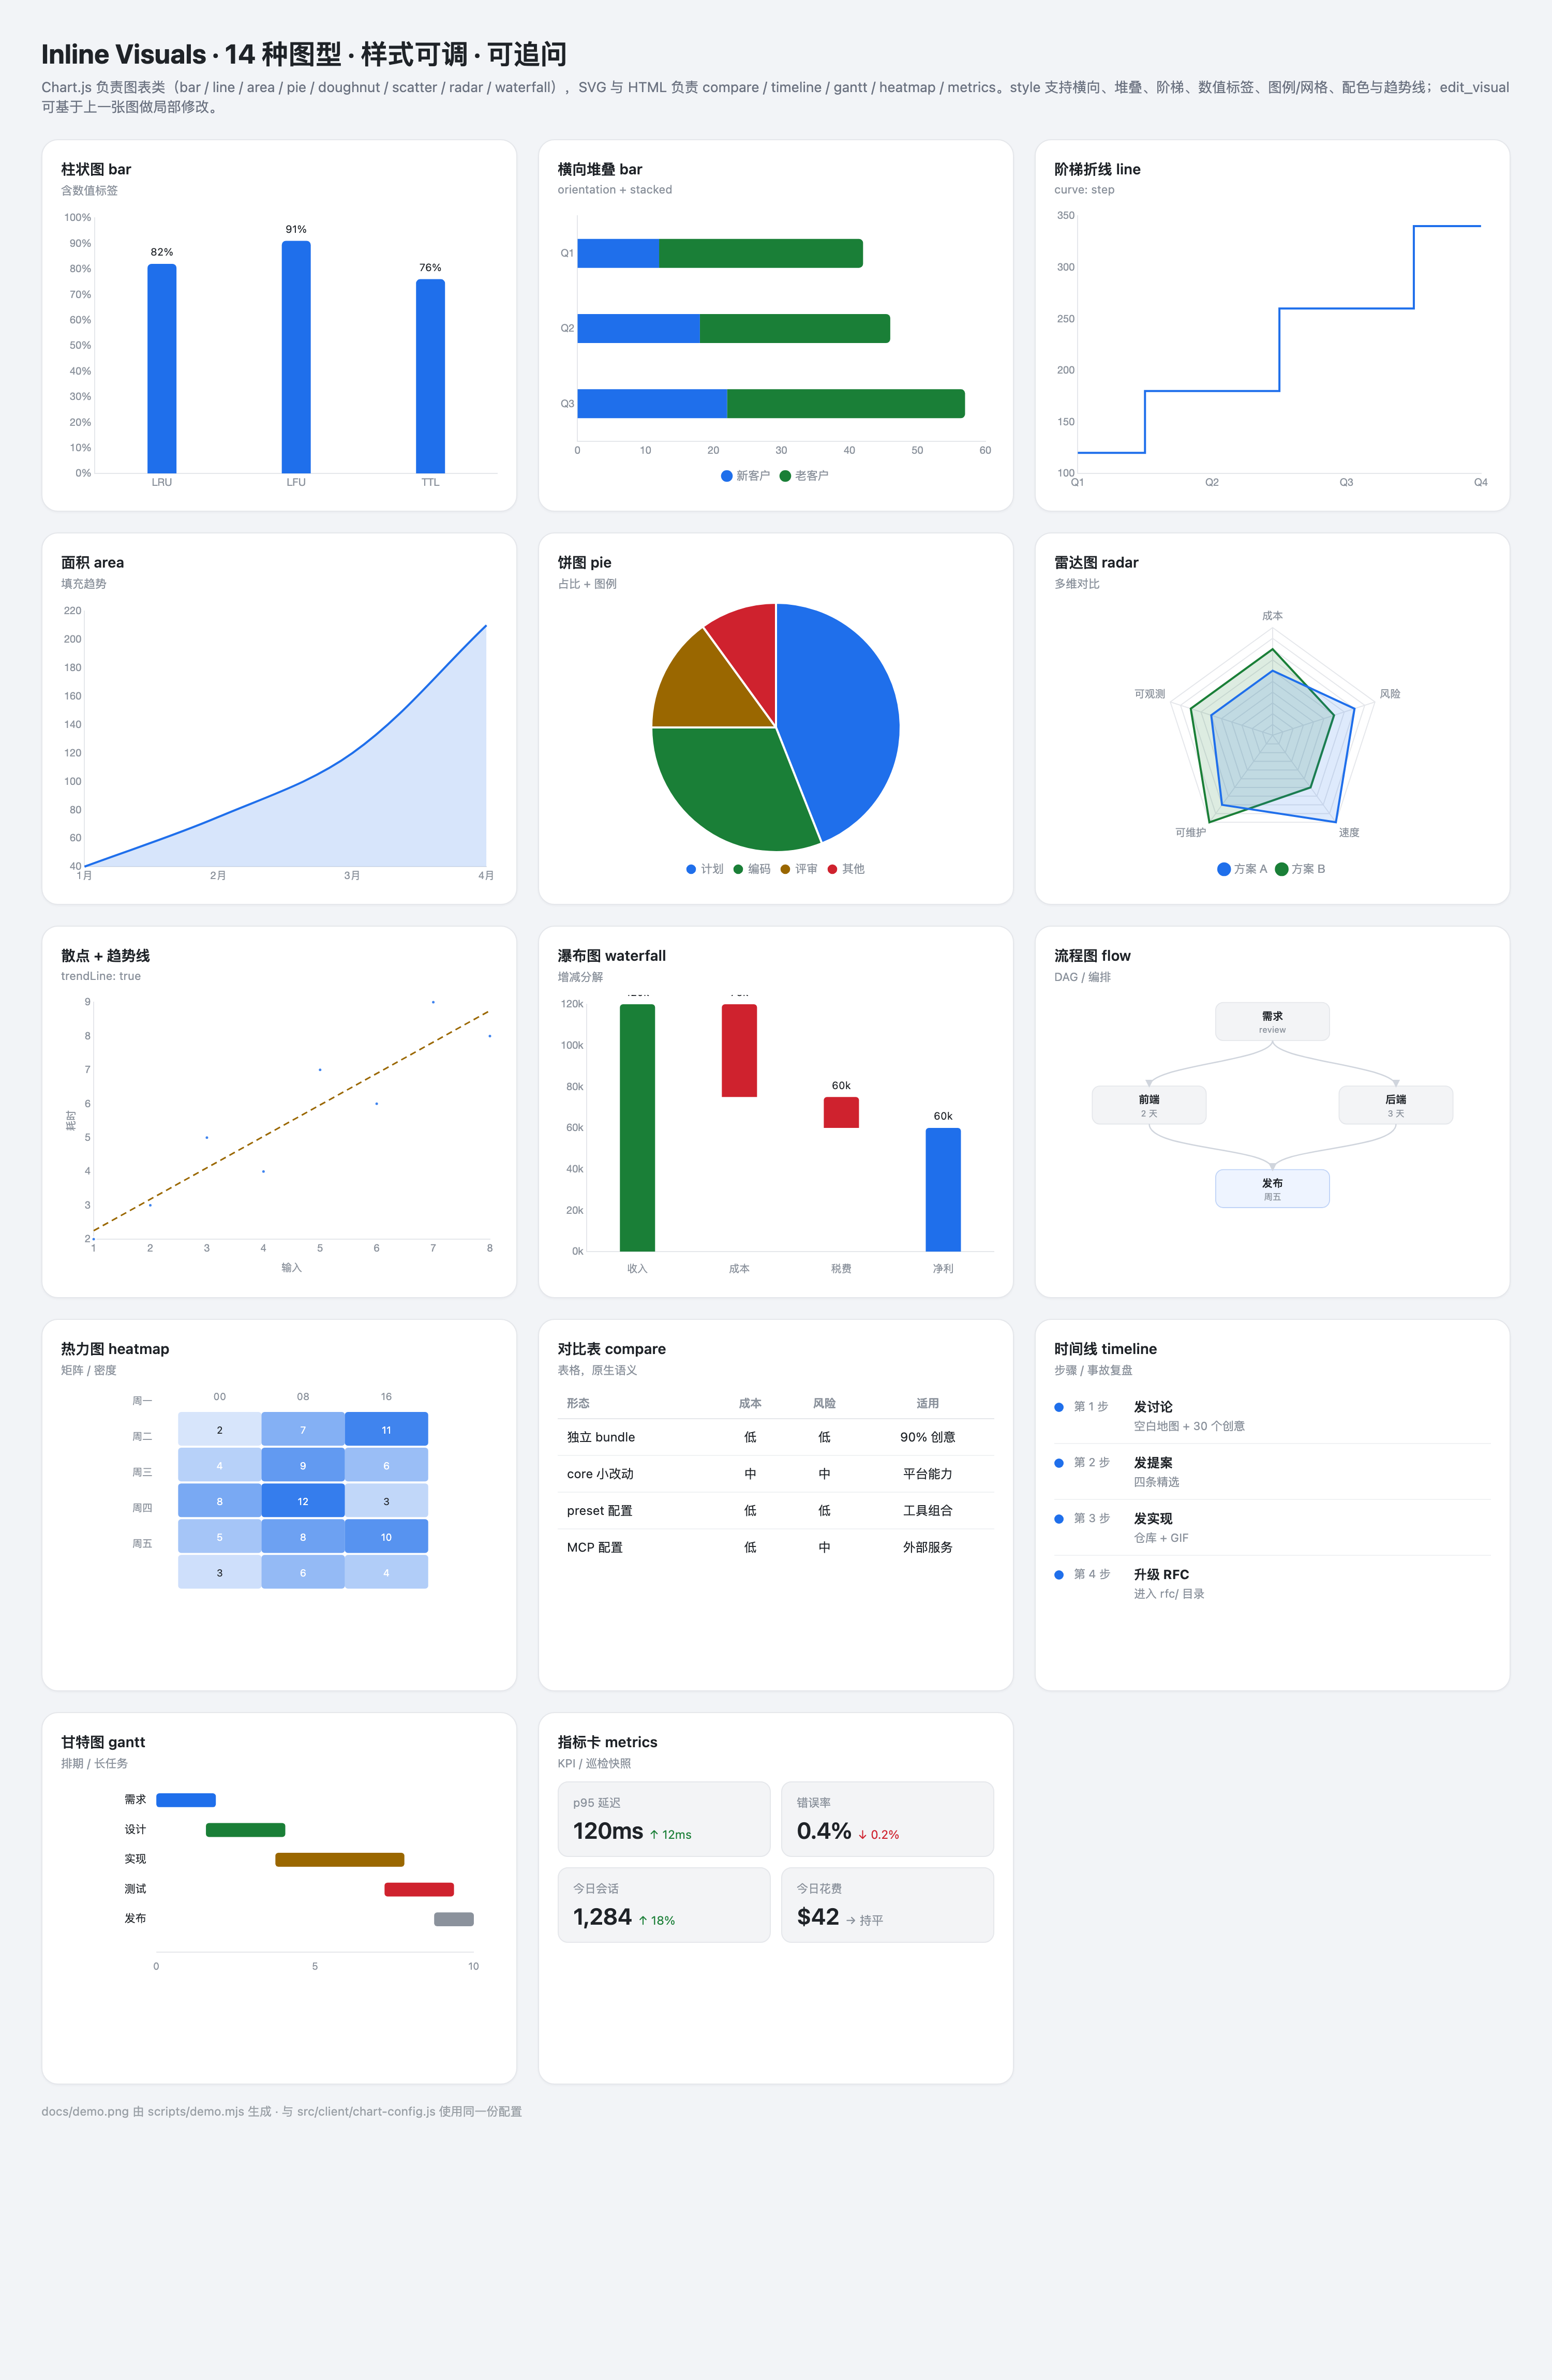
A plugin for DeepSeek Harness that turns numbers into pictures inside the conversation: 18 kinds of charts, tables, timelines, gantt, heatmaps, flows and KPI tiles — plus ML/paper visuals such as training curves, ROC/PR curves, confusion matrices, leaderboards and embedding clusters. With styles, exports and click-to-ask.




Why you'll like it
- Figures in the answer, not just the tool log. The final chart of a turn lands beneath the reply.
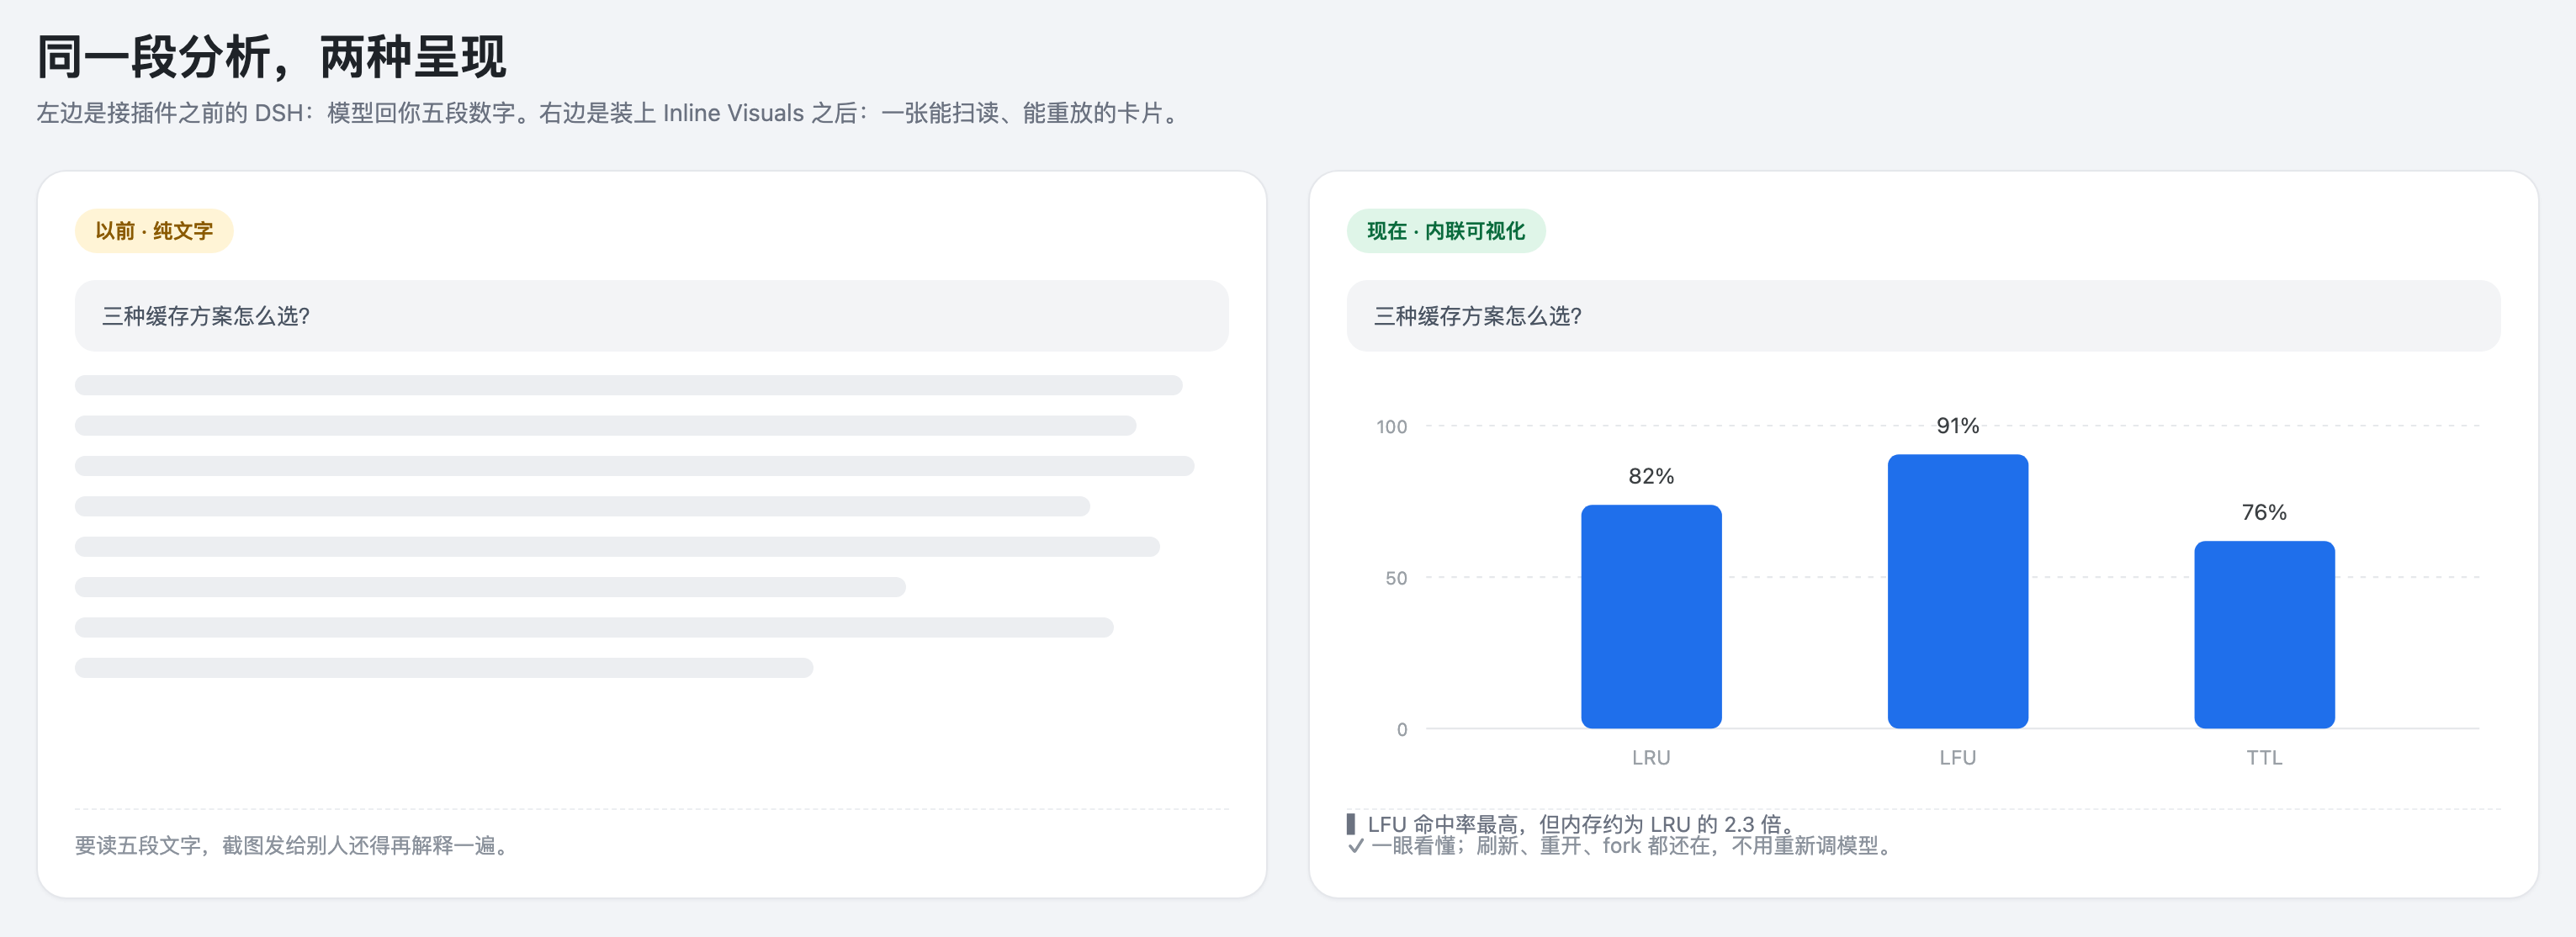
- See it, don't read it. "Three caching strategies, compared" becomes a card you scan in two seconds.
- It stays. The card is stored in the session log — refresh, reopen, branch the session, it is still there.
- Ask, don't retype. Click any data point, get a one-click follow-up prompt in your composer.
- Change it by talking. "Make it horizontal and stacked, with labels." The agent patches the chart
with
edit_visualinstead of redrawing everything. - Native and safe. Follows the host theme (light/dark, English/Chinese). The model sends data, never HTML or JavaScript.
- Made for ML & papers. Training curves with log axes, smoothing and error bars; ROC/PR with AUC; confusion matrices; model leaderboards; embedding clusters; histograms.
- Made to share. Copy JSON/CSV, export PNG or SVG.
Install in 30 seconds
Inside a DSH session, paste one line:
plugin_manager({ action: "install_bundle", target: "dsh-inline-visuals" })
No clone, no configuration. You should see show_visual (and edit_visual) among your agent's tools.
Requires DeepSeek Harness
v0.2.1-rc.3or newer. Prefer source? Usegithub:YLifeOnlyOnce/dsh-inline-visuals, or point Plugin Manager at a local clone (see the technical reference).
Try it
Just talk to your agent:
"Compare three caching strategies — hit rate, memory and complexity — as a chart."
"Turn that into a horizontal stacked bar, and add value labels."
"Draw our release pipeline as a flow."
"Show last week's traffic as a heatmap."
What it can draw
| Charts | bar · line · area · pie · doughnut · scatter · radar · waterfall |
| ML & papers | training curves · ROC/PR curves · confusion matrix · histogram · model leaderboard · embedding scatter |
| Everything else | compare table · timeline · gantt · heatmap · flow · KPI tiles |
Every visual accepts presentation styles: horizontal or stacked bars, stepped lines, data labels, legends, grids, five palettes, height and density, scatter trend lines, log axes, EMA smoothing and error bars.
Built for ML & paper reading
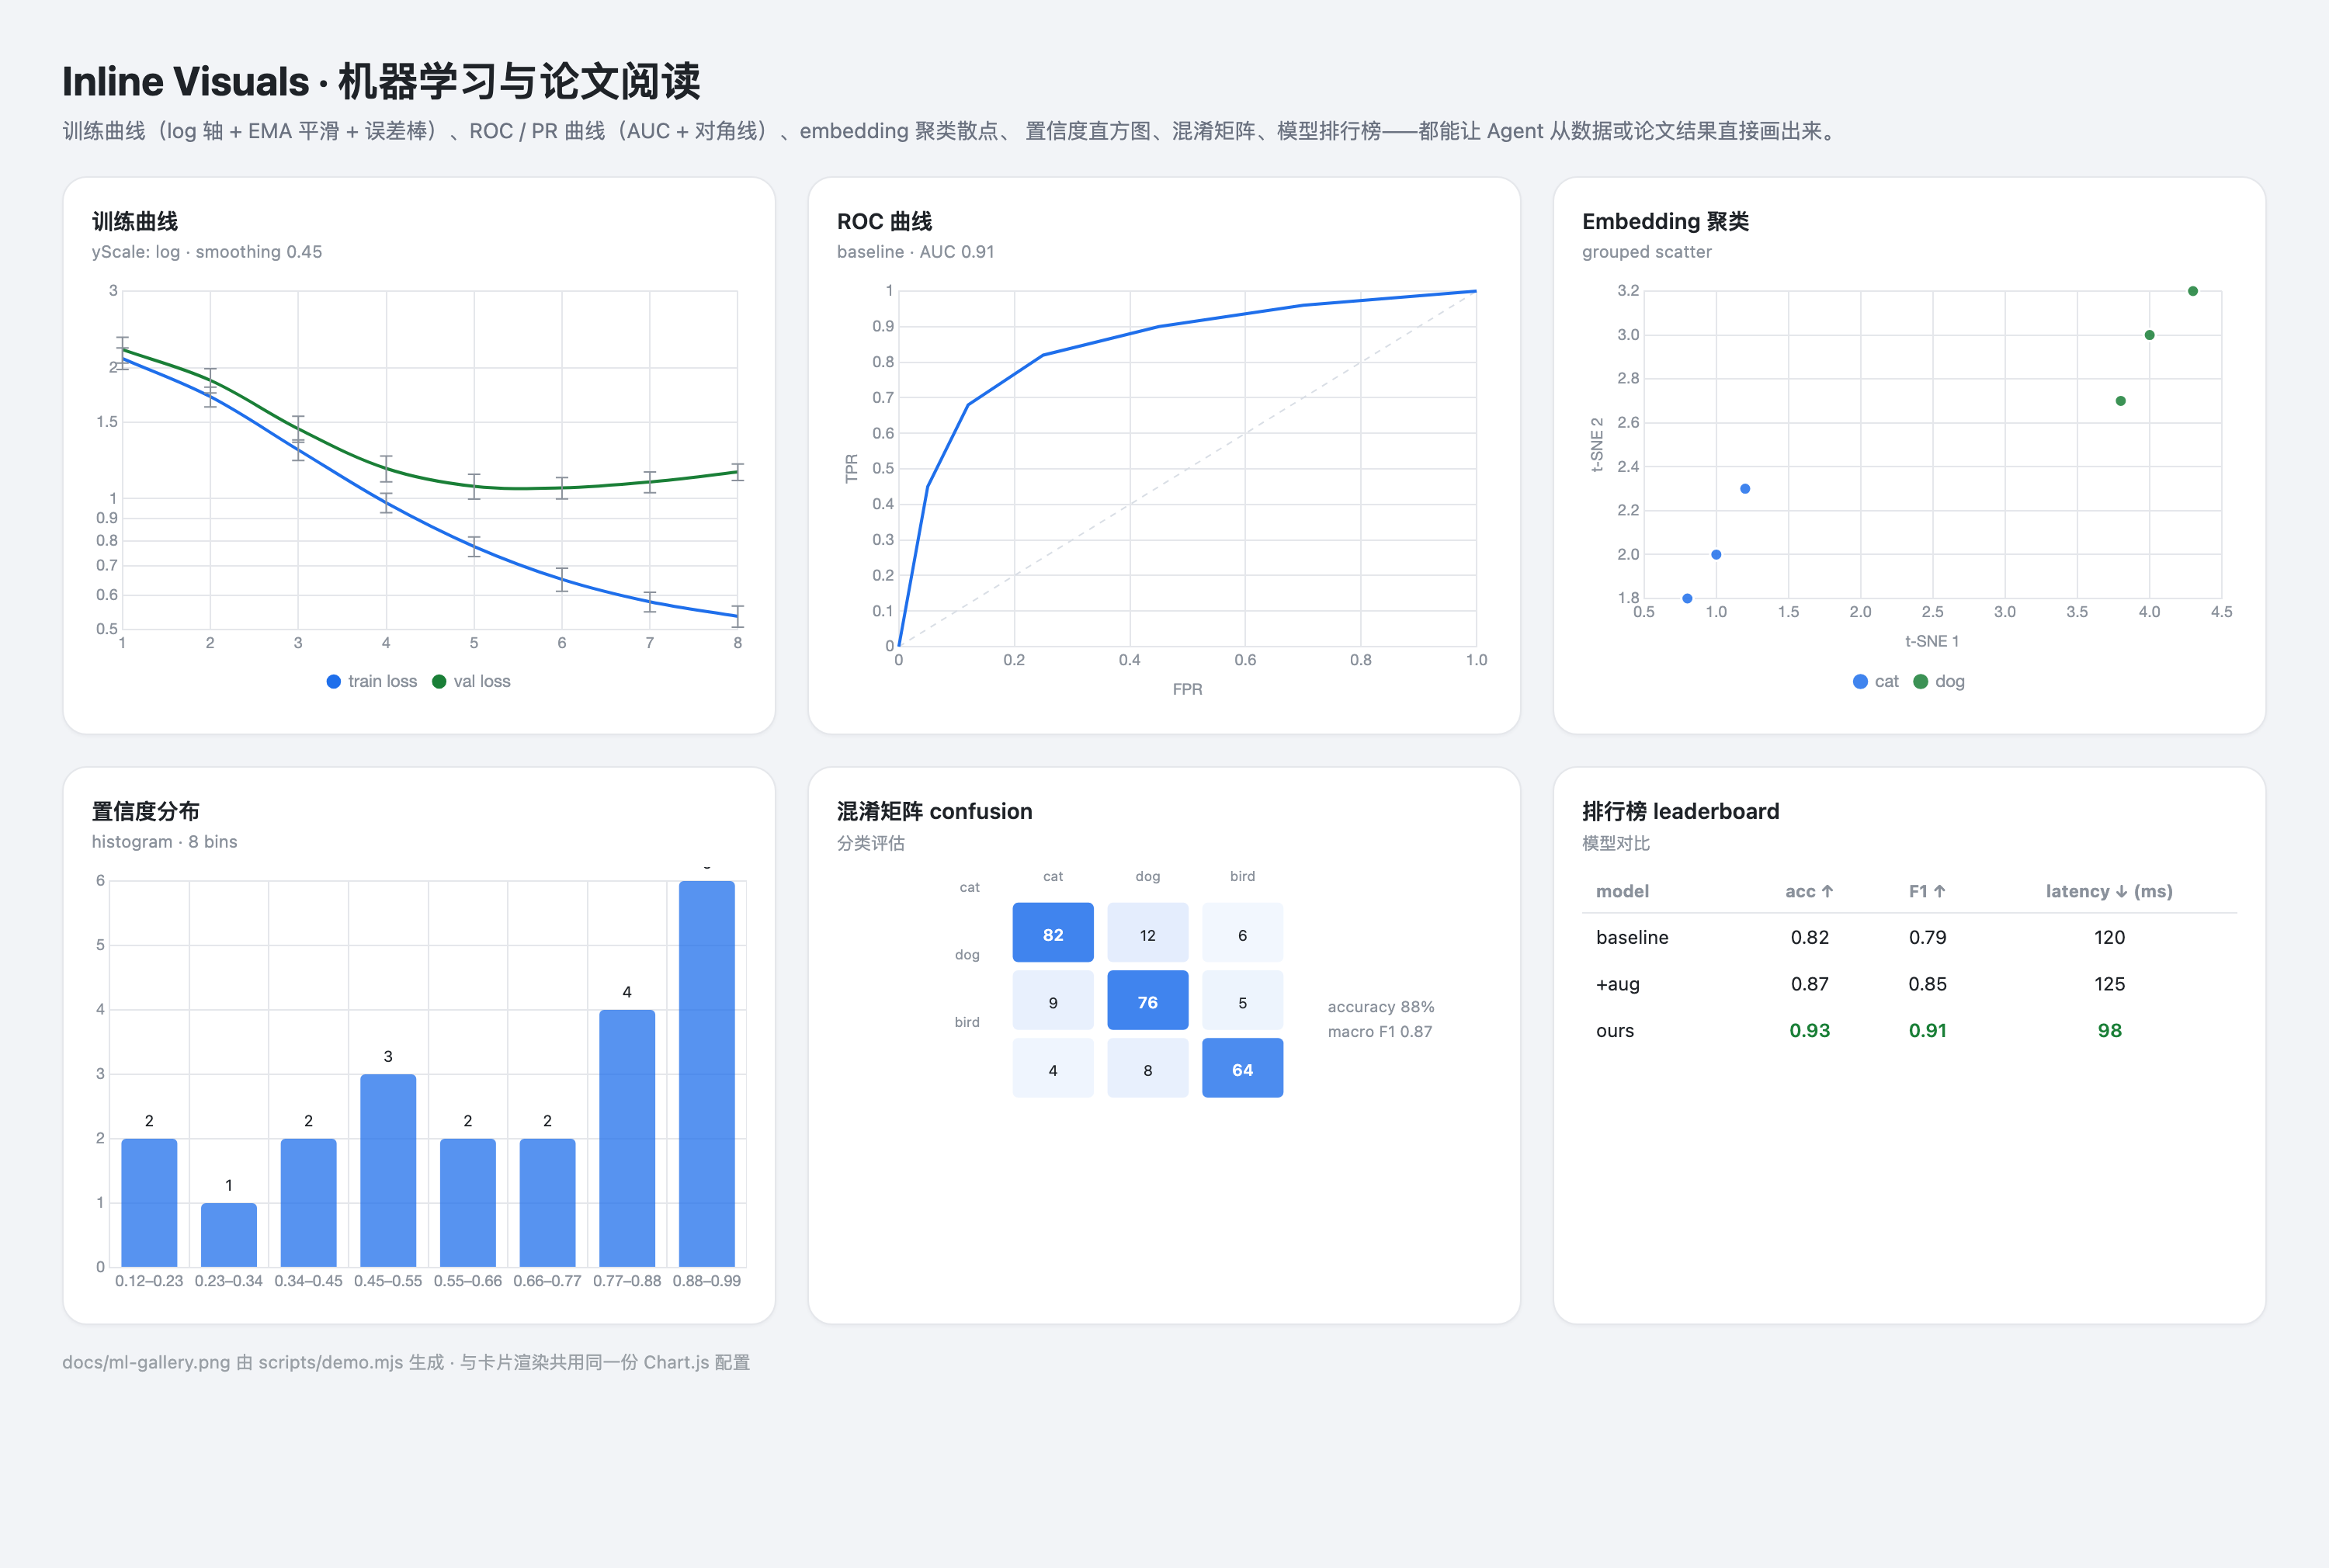
Reading a paper or a training log? Ask for the figure:
"Plot train/val loss for 8 epochs on a log scale, smoothed, with error bars."
"Draw the ROC curve from these points and mark AUC."
"Make a confusion matrix for cat/dog/bird from this table."
"Compare these four models on accuracy, F1 and latency — highlight the best."
"Cluster these embeddings by class and show a t-SNE scatter."
How it works (in one breath)
The model sends a small, declarative spec → the plugin validates and stores it on the tool result → your client renders it with the host's theme. Because the data lives in the session log, replays need no extra model call.
FAQ
Do I need to configure anything? No. Install and ask.
Where do the cards live? In the session log (tool/result.meta), not in a separate file.
Does it send my data anywhere? No. The plugin performs no network calls; the model already sees what you typed.
Can I get the numbers out? Copy as JSON or CSV; charts export as PNG; hand-drawn cards as SVG.
Which kinds are interactive? Click-to-ask works on chart kinds (canvas). More surfaces are on the roadmap.
Text-only clients? They receive a compact text summary instead of the card — nothing is lost.
Under the hood
- 38 tests (
node:test), CI on every push, tag-driven npm release with provenance. - ~35 KB host half, one self-contained browser file (~217 KB, Chart.js inlined, React shared with the host).
- Spec
version: 3is stable; v1/v2 specs still render.
Full parameter reference, limits and development notes: docs/reference.md. Changelog: CHANGELOG.md. Contributing: CONTRIBUTING.md.
License
MIT © 2026 YLifeOnlyOnce
No comments yet. Be the first to write one.