dsh-planchart
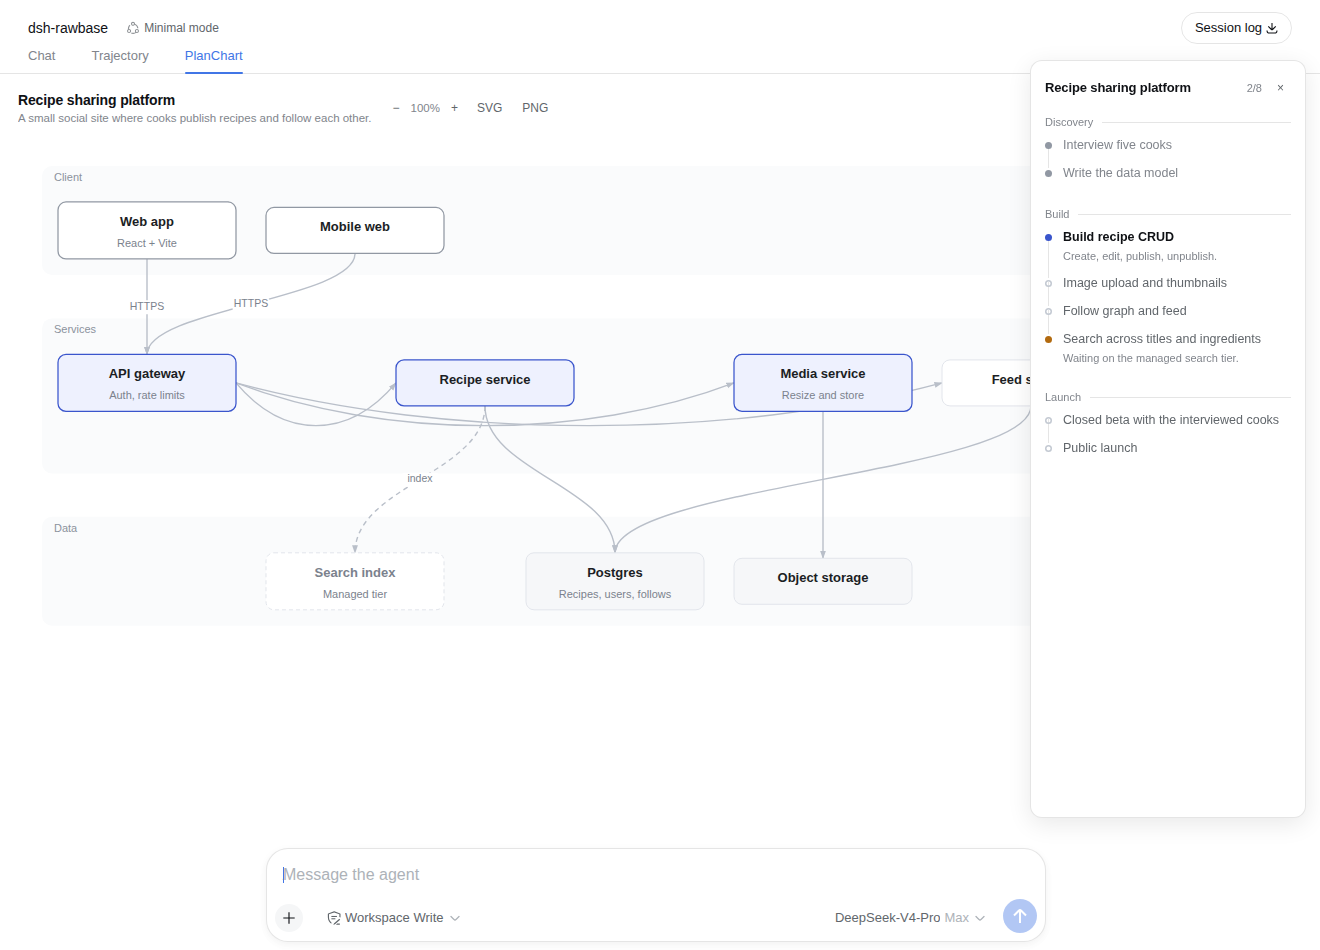
A DeepSeek Harness (dsh) plugin that gives the agent a display surface for
project planning. The model calls one tool with the whole plan; the browser
renders it in two places:
- the steps — a panel docked to the right edge of the frame, with phases, status marks and per-step detail;
- the framework — a "PlanChart" tab beside Chat and Trajectory, holding an auto-laid-out architecture diagram that downloads as SVG or PNG.
Talking to the agent again updates both: every planchart_set call replaces the
whole chart, so "mark step 3 done" or "add a cache layer" is an ordinary
follow-up message.
Install
dsh plugin --profile web add ./dsh-PlanChart
Then restart the profile (dsh web) and hard-reload the browser tab. The
plugin declares dsh.bundle.patch, so the installer adds it to the profile's
bundle stack automatically; its browser half is discovered through dsh.client
and served at /plugins/dsh-planchart/client.js.
The reload is not optional. The client plugin table arrives as
window.__DSH_BOOT__, injected intoindex.htmlat page load. A tab that was already open when you restarted keeps its old manifest and will never fetch the new bundle — the tools run, the chart is stored, and the browser shows nothing. This is true of every dsh client plugin, not just this one.
To remove it: dsh plugin --profile web remove dsh-planchart.
Tools
| Tool | What it does |
|---|---|
planchart_set |
Publish the whole chart: title, optional summary, steps[], and a framework graph. Replaces the previous chart wholesale. |
planchart_get |
Read back the chart currently displayed, as text — for revising a chart the model no longer has in context. |
There is also a /planchart slash command that prints the current chart.
Step shape
{ "id": "…",            // optional; derived from the title when omitted
  "title": "Build recipe CRUD",
  "status": "pending",  // pending | active | done | blocked
  "detail": "create, edit, publish",   // optional
  "phase": "Build" }                   // optional; consecutive steps group under it
Framework shape
{ "direction": "TB",                       // TB (default) or LR
  "groups": [{ "id": "…", "label": "Client" }],
  "nodes":  [{ "id": "…", "label": "Web app", "kind": "entry",
               "note": "React + Vite", "group": "client" }],
  "edges":  [{ "from": "web-app", "to": "api-gateway",
               "label": "HTTPS", "dashed": false }] }
kind chooses how a box is drawn, not what it means. Ids may be omitted
everywhere — one is derived from the label (CJK labels keep their characters),
which is what edges then reference.
Visual language
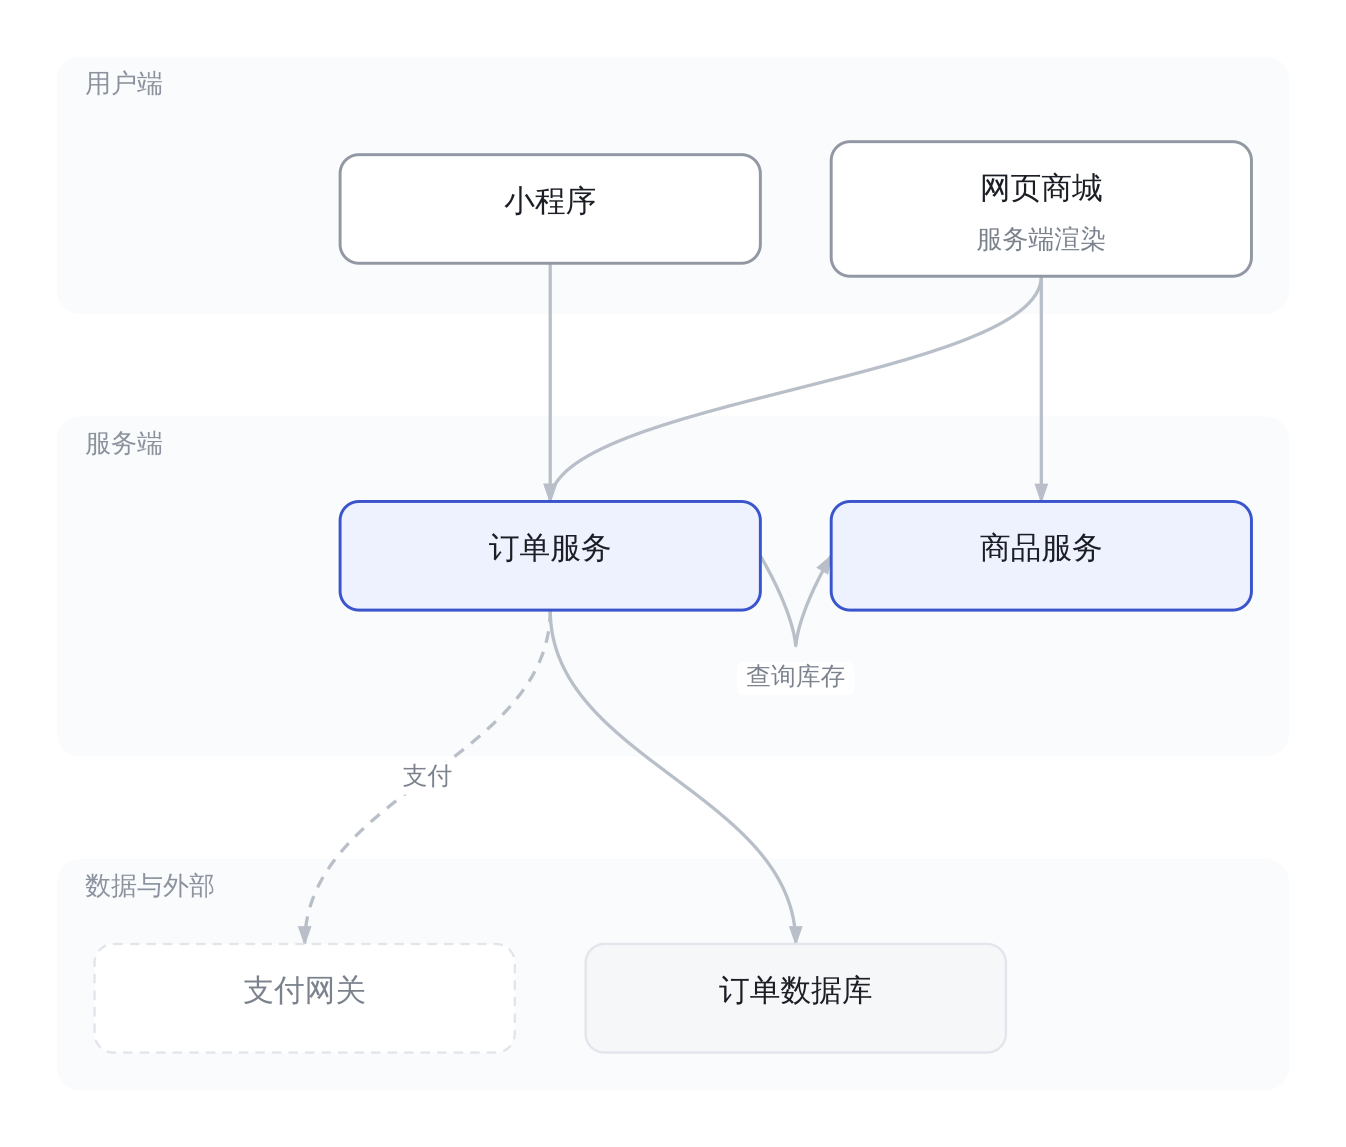
The diagram is monochrome structure with exactly one accent, so a nine-box graph does not turn into nine competing fills:
kind |
Drawn as | Why |
|---|---|---|
core |
tinted fill, accent border | the only colour on the canvas — the part that does the work, and where the eye should land first |
entry, output |
firm border, no fill | the system's boundary |
store |
faint fill, hairline | holds something |
external |
dashed hairline, muted text | not yours |
default |
hairline | supporting cast |
Bands are a 2% tint with no outline, edge labels sit on a borderless plate that
knocks a hole in the line they cross, and the steps panel spends its one accent
on the single active step. A finished step keeps its title and drops its
detail: the explanation of work already done is the first thing worth removing
from a panel read at a glance.
Layout
Two modes, chosen from the data:
- Bands — when every node names a declared group, the groups become the rows
(or columns under
LR) and each is drawn as a labelled band. This is the natural reading of a layered architecture. - Layered DAG — otherwise the edges decide the ranks (longest path), ordered by one barycenter sweep.
Both then run the same priority placement so a child sits under its parents rather than under the middle of its row, and edges between siblings in one rank duck through a reserved lane below it instead of cutting across the boxes.
How the chart reaches the browser
The chart rides tool/result.meta — the documented tool-private, replayable
payload channel — and a planchart session projection folds it back out:
planchart_set.execute → output.presentationMeta → tool/result.meta (durable log)
                                                          ↓
                                        projection `planchart` (apply/view)
                                                          ↓
                                  session/projection push frame → useProjection
Why not a session event of its own. An out-of-repo event type is absent from
this build's KNOWN_SESSION_EVENT_TYPES, and Session.append offers no way to
mark an event ignorable. Writing planchart/write would therefore make every
session that used the plugin permanently unloadable after a restart — the
persistence read path refuses a log containing an unknown, non-ignorable type.
Riding meta on an ordinary tool/result adds no vocabulary at all, and replays
identically.
Consequences worth knowing:
- The chart survives restart, resume and fork, because it is derived from the log.
- Unlike the todo list it is not cleared by the next turn: a published chart is the standing shape of the project.
presentationMetais computed for top-level calls only, so a chart published from inside a subagent does not reach the panels.
Both halves
- Host (
lib/index.js) — the two tools, the projection unit, the system prompt section, the/planchartcommand. Optional seams (sessionProjections,systemPrompt,commands) are taken throughctx.inject, so a headless composition without them still gets the tools. - Browser (
lib/client.js) — hand-authored in the lazy-CJS bundle form the client module loader expects (window.__ModuleLoader__.load({ id, factory })), so there is no build step. It registers intoconversation.view(the tab) andshell.overlay(the steps panel).
The diagram is drawn with presentational attributes and literal colours — no CSS
classes, no var(--dsw-*) — so serializing the live <svg> yields a file that
renders standalone once downloaded. It follows the app's light/dark theme by
watching data-ds-dark-theme on <body>.
Why the steps panel floats
ui-layout offers four root seats: sidebar, conversation, details and
shell.overlay. The right-hand details column is a single slot already
occupied by ui-conversation's DetailsPanel, and registering there would replace
it and take the tool-details seat with it. shell.overlay is the documented
additive seat for a frame-wide surface, so the steps panel lives there: docked
right, collapsible to an edge tab, and remembered in localStorage. Being
root-scoped it gets no useProjection, so it reads the same per-key observable
through ctx.sessions.binding(id).session.projections.faceOf('planchart').
Config
- insert:
    - id: planchart
      name: dsh-planchart
      config:
        promptSection: true   # false keeps the tools but stops advertising them
Tests
npm test                     # host half: registration, the durable round trip, validation
node test/render-preview.mjs # renders the browser half with real React → test/preview.{html,svg}
render-preview.mjs loads lib/client.js through a stub of the client module
loader and server-renders both seats, asserting that every node and edge is drawn
and that no box escapes the canvas.
Limitations
- Charts are per session; there is no cross-session library.
- The steps panel floats over the conversation rather than shrinking it (see above); collapse it to the edge tab when it is in the way.
- Diagram layout is deterministic but not optimal — heavy graphs (dozens of nodes with many cross-rank edges) will still cross.
- Caps: 60 steps, 80 nodes, 200 edges, 12 groups. Oversized input is rejected loudly rather than truncated.
中文说明
dsh-planchart 给 agent 增加一块项目规划的展示面板。模型用一个工具发送完整的
规划,浏览器分两处渲染:
- 步骤 —— 停靠在窗口右侧的面板,带阶段分组、状态标记和每步说明;
- 框架 —— Chat / Trajectory 旁边的 "PlanChart" 标签页,自动排版的架构图,可以 下载 SVG 或 PNG。
继续对话即可修改:每次 planchart_set 都整体替换当前的图,所以"把第三步标记完成"
或"加一层缓存"就是一句普通的后续消息。
安装
dsh plugin --profile web add ./dsh-PlanChart
然后重启 profile(dsh web),并且硬刷新浏览器页面。插件声明了
dsh.bundle.patch,安装器会自动把它加入 profile 的 bundle 列表;浏览器半边通过
dsh.client 被发现,served 在 /plugins/dsh-planchart/client.js。
刷新这一步不能省。客户端插件表是
window.__DSH_BOOT__,在页面加载时注入index.html。重启前就开着的标签页会一直用旧的清单,永远不会去取新 bundle —— 结果是工具照常执行、图也存下来了,但界面上什么都不显示。这对所有 dsh 客户端 插件都成立,不只是这个插件。
卸载:dsh plugin --profile web remove dsh-planchart。
工具
planchart_set—— 发布整张图:title、可选summary、steps[]、framework图。planchart_get—— 把当前显示的图读回成文本,供模型在上下文丢失后再修改。/planchart—— 斜杠命令,打印当前的图。
节点和步骤的 id 都可以省略,会从标题/标签推导(中文标签保留原字符),边再引用它。
视觉语言
整张图是单色结构 + 一处强调色,避免九个方框变成九种互相争抢的填充:core 是画布上
唯一有颜色的东西(做实事的部分,视线首先落在这里);entry/output 用较实的描边表示
系统边界;store 是极淡的填充;external 用虚线描边加灰字,表示"不属于你";
其余是发丝线。分带只有 2% 的色调、没有描边,边上的文字压在一块无边框的底板上,把它
穿过的那条线截断。
右侧面板同理:唯一的强调色给"进行中"那一步。已完成的步骤保留标题、去掉说明——一个 用来扫一眼的面板里,最该先删掉的就是已完成工作的解释。
数据怎么到浏览器
图挂在 tool/result.meta(工具私有、可重放的载荷通道)上,由 planchart
session projection 折叠出来,再通过 session/projection 推给浏览器。
为什么不自定义 session 事件类型:本次构建的 KNOWN_SESSION_EVENT_TYPES 不包含
仓库外的事件类型,而 Session.append 没有提供把事件标记为 ignorable 的入口。写入
planchart/write 会让用过该插件的每个 session 在重启后永久无法加载——持久化读取
路径会拒绝含有未知且非 ignorable 类型的日志。挂在普通 tool/result 的 meta 上不
新增任何事件词汇,重放结果完全一致。
因此:图能跨重启、resume 和 fork 保留;与 todo 列表不同,它不会在下一轮被清空;
presentationMeta 只对顶层调用计算,所以子 agent 里发布的图不会出现在面板上。
已知限制
- 图按 session 保存,没有跨 session 的图库。
- 步骤面板浮在对话之上,不会挤压中间栏;挡路时可以折叠成右侧边缘的小标签。
- 排版是确定性的但不是最优的,节点很多且跨层边很密时仍会有交叉。
- 上限:60 步、80 节点、200 条边、12 个分组,超出会直接报错而不是截断。
No comments yet. Be the first to write one.