🦃 token-gobbler
same gobbling, different invoices. watch the corp tokens get chomped.
Using DSH is running model evaluations. Every session — every prompt, tool call and turn — is a measurement of the model that served it. The token gobbler is the audit of that: which model did the work, how it performed, and whether the bill is honest.
A DeepSeek Harness composition plugin that reads your DSH session data, counts every token you fed the machine (fresh input, output, cache reads, cache writes), attributes those tokens to the models that actually produced them, and prices the whole gobbling against the models your corp could've billed you for — Copilot's Claude / Grok — next to the free local models you're actually running.
It's a little turkey with a spreadsheet. The turkey is you. The spreadsheet is the invoice.
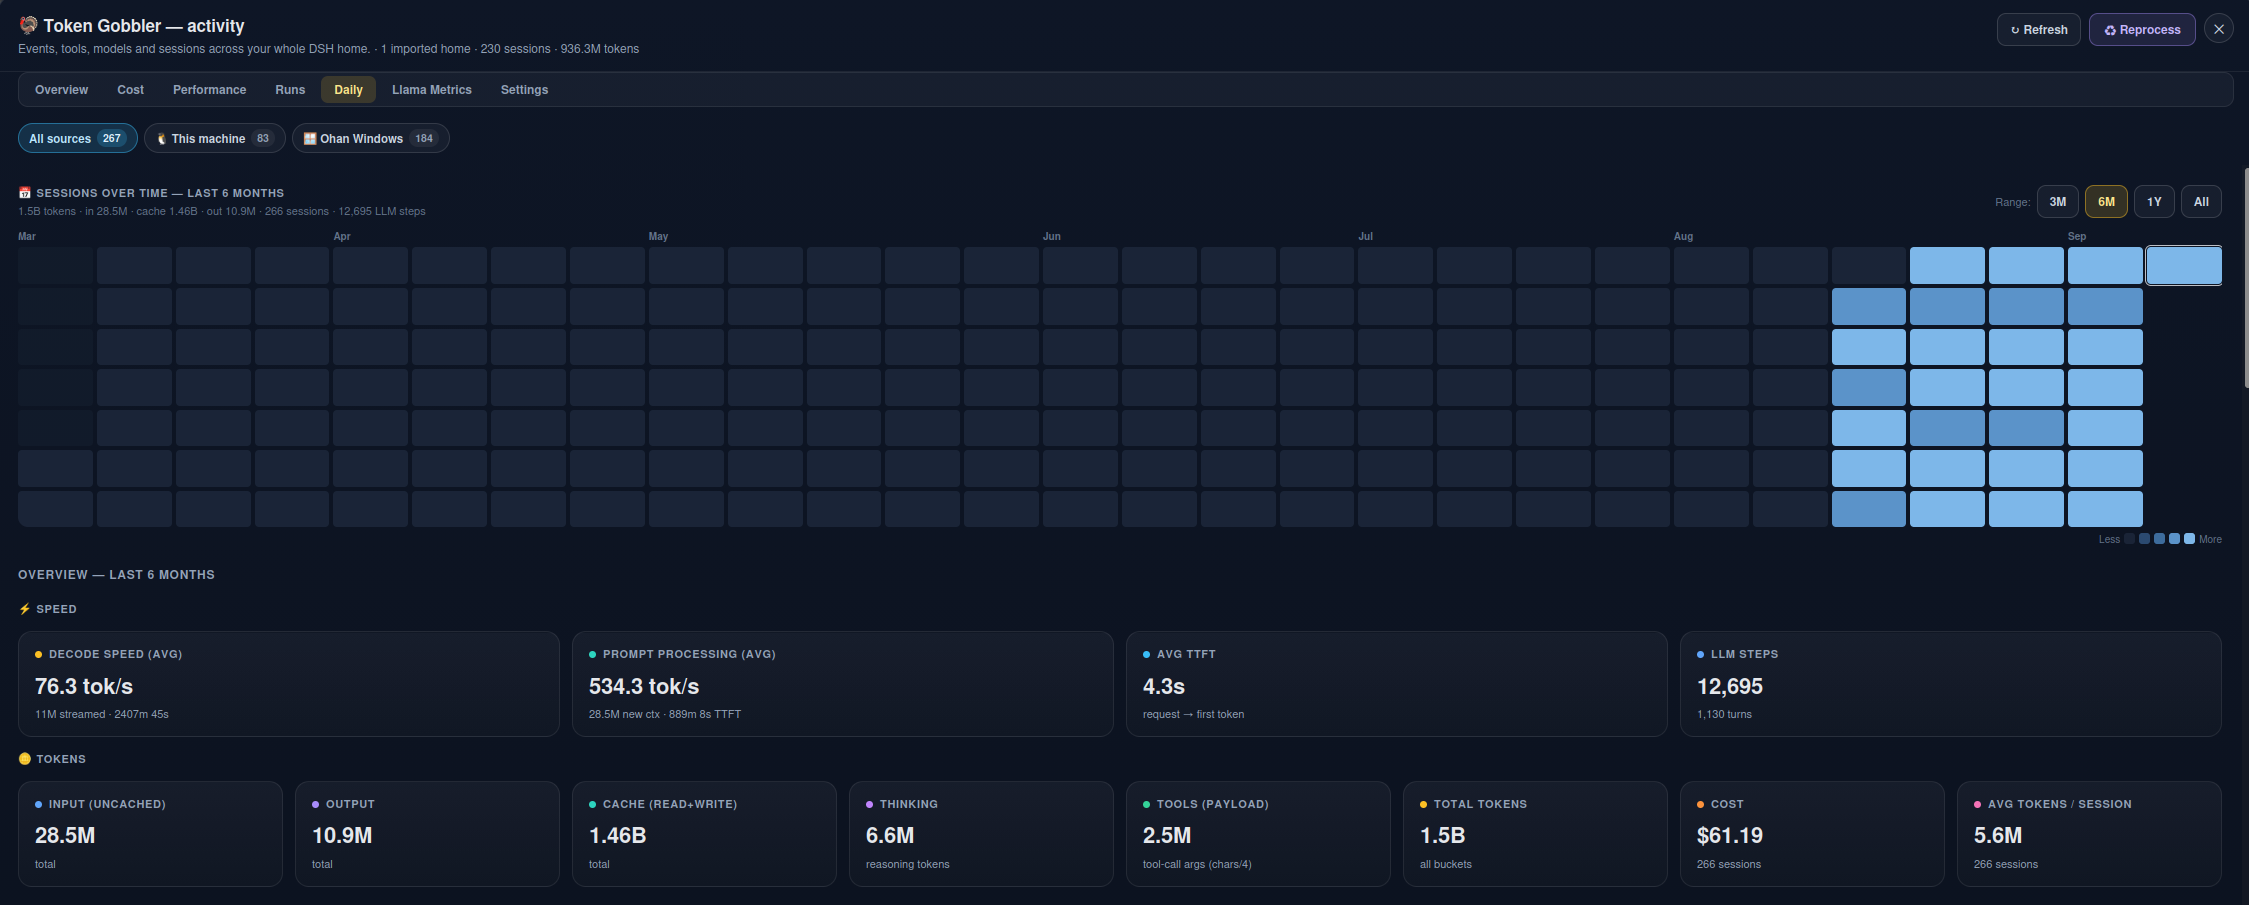
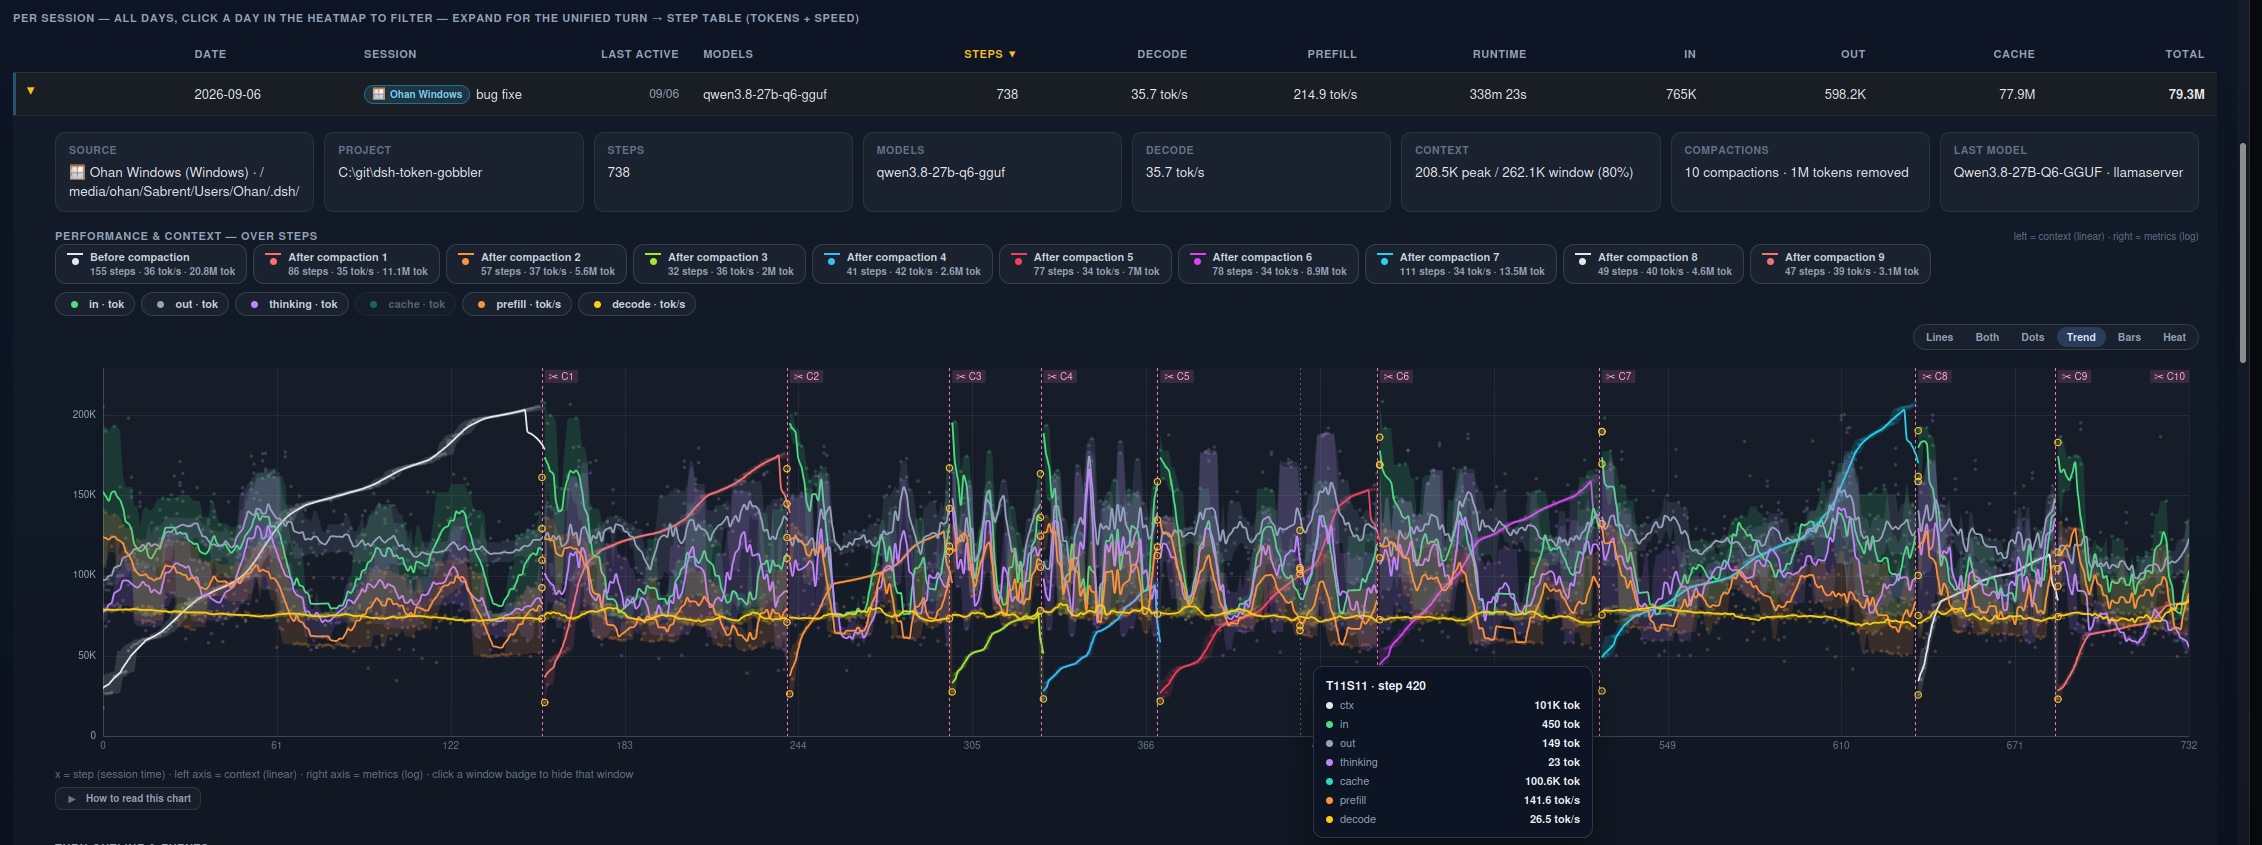
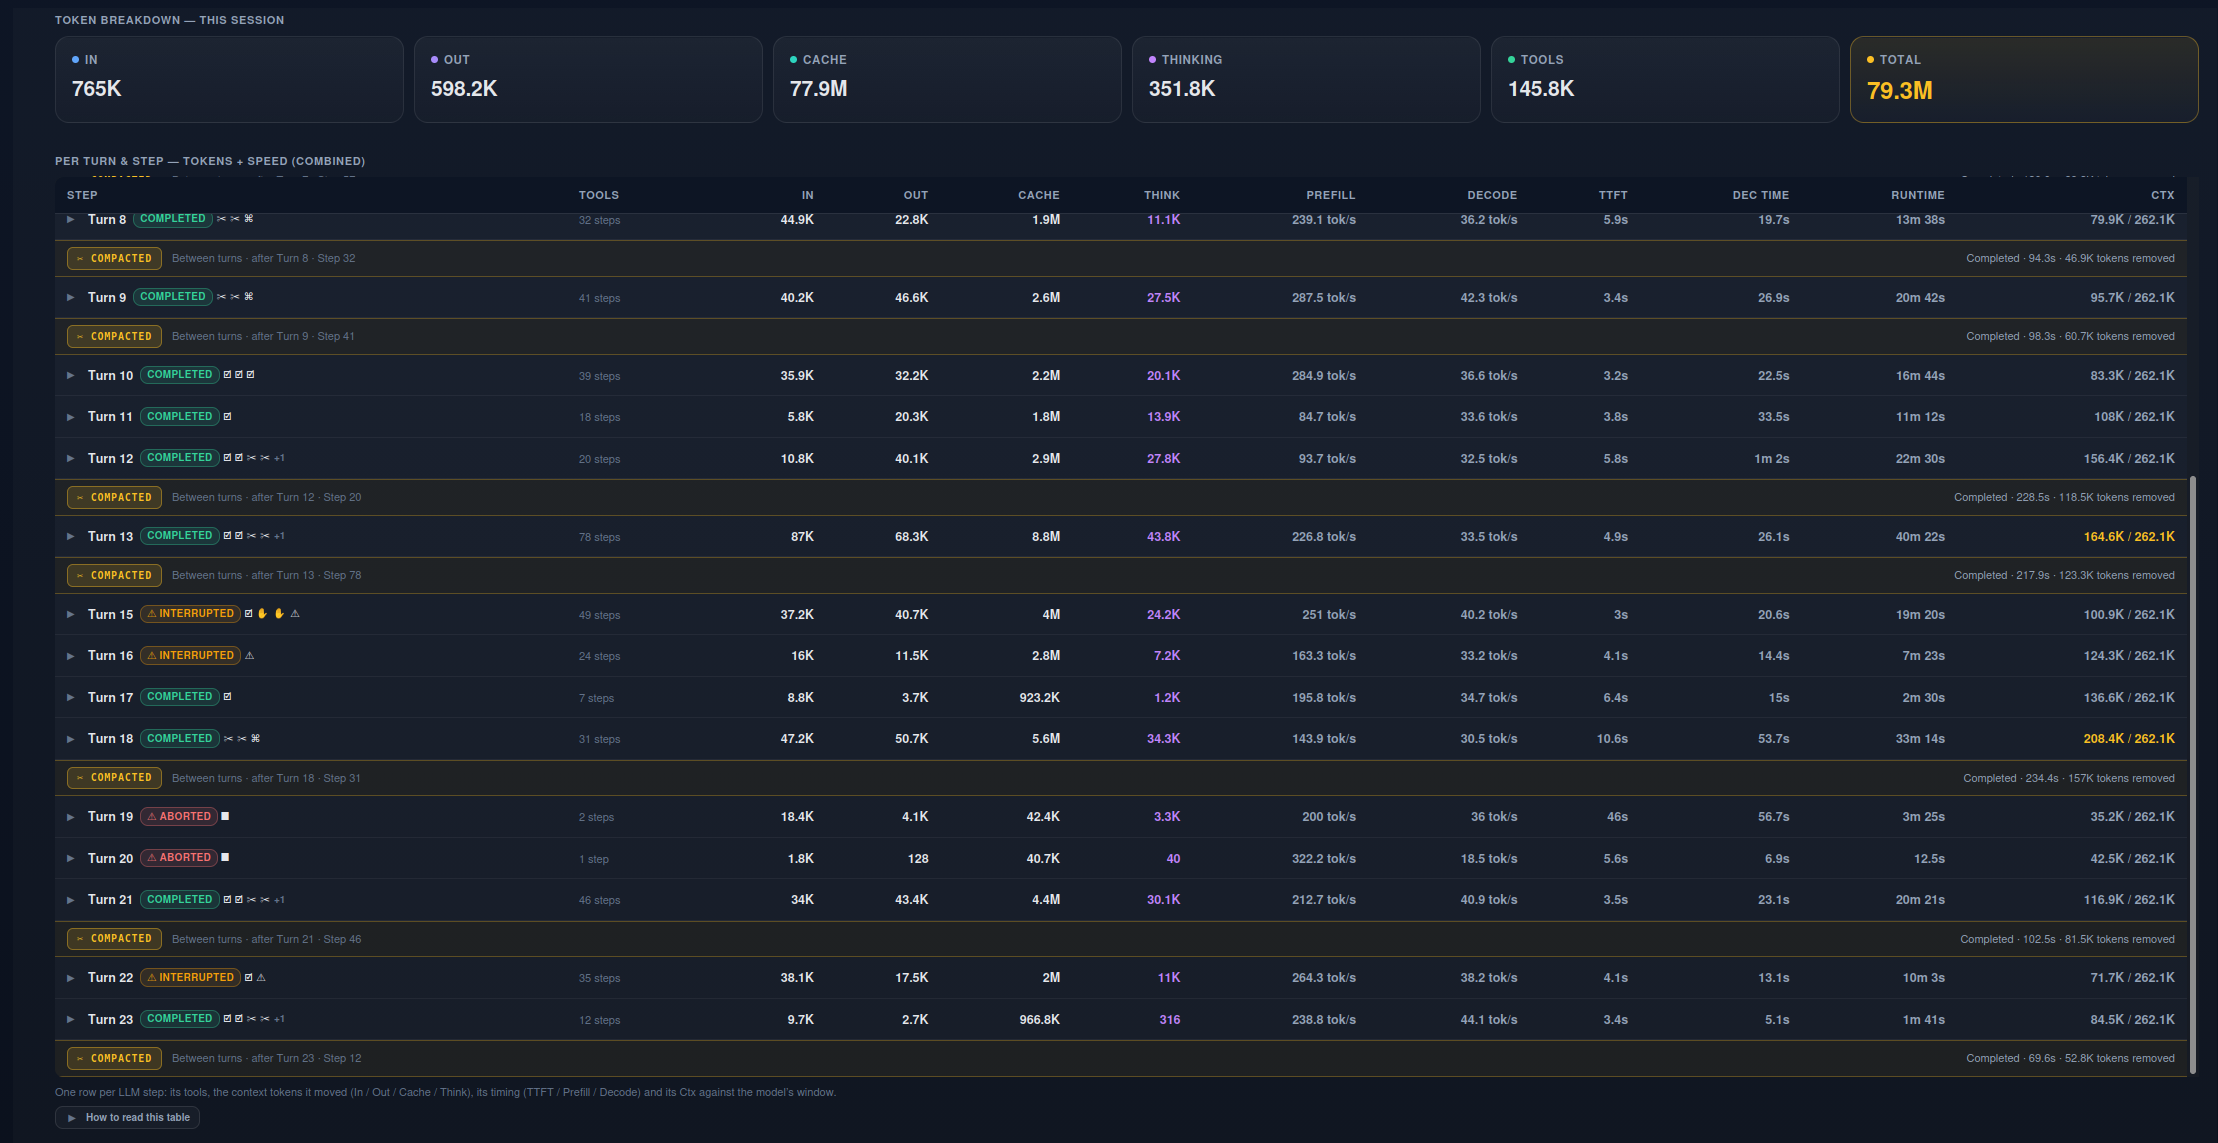
The activity modal, Daily tab — filter by home (all sources / this machine / an imported one), open a day, open a session: stat cards on top, that session's context & throughput chart underneath (Trend mode here — one line per metric, the raw steps faint behind it, the ✂ compaction boundary marked), and the turn-by-turn outline of every prompt, tool call and compaction at the bottom.
What it does
Reads the trajectory file DSH keeps per session — ~/.dsh/sessions/<ws>/<sid>/session.jsonl.zstd, a
multi-frame zstd JSONL event log — and reconstructs, per session:
- Model attribution — which provider/model served each step, matched against the projection
store's authoritative totals and split across the models actually used. Best available: exact
per-turn
usagechunks, else estimated by step count, else the profile default model. - Token buckets — uncached input, output, cache read, cache write (thinking is a subdivision of output, never double-counted).
- Speed — decode tok/s (streamed output ÷ time from first chunk to the usage chunk) and prefill tok/s (new input ÷ TTFT), plus per-step thinking time.
- Per-tool cost — the actual tool-call argument payload (~chars/4), not the whole step context.
- Pricing — a rate-card table (corp vs local) with a WFH / corp cost split.
The hard parts (multi-frame zstd decompression, per-step timing from chunk/step timestamps, a two-layer
in-memory + disk parse cache with a ♻ Reprocess reset) live in lib/trajectory.ts and
lib/report.ts.
Every DSH session is a model evaluation
You don't have to set up a benchmark — using DSH is the benchmark. The harness routes each turn to whichever model the profile picked and records the whole exchange: the prompt, the tools the agent called, the streamed output, the timings, the retries, the compactions, the outcome. Every turn is one data point; a day of DSH work is an evaluation suite you already ran.
Token Gobbler is the audit of that suite, and it is deliberately model-agnostic: it reads the same trajectory whatever produced it, so a local Qwen on llama.cpp, a DeepSeek API model and the corp's Claude are all measured by the same yardstick.
- Which model did the work — per-step model attribution, including the step a session switches models mid-run (the ⇄ marker on the chart).
- How it performed — decode and prefill tok/s, TTFT, step wall-time, output per step, and the context growth the ✂ compaction boundaries reset.
- What it cost — tokens by bucket, priced against the corp rate card and the local one.
- How each turn went — its outcome badge (completed / aborted / error / max tokens / …), plus the retries, approvals, tool calls and compactions behind it.
Read it at three levels: the Runs tab compares a model's own runs like-for-like, the Compare tab puts 2–4 runs of different models on one chart (resampled onto a shared progress or runtime axis), and the invoice says whether the performance you paid for is the performance you got. 🔌 Imported sources folds other DSH homes — other boxes, other OSes — into every number, so the audit covers every model you run through DSH, anywhere. When you compare a local Qwen against the corp's Claude, you're not just saving money; you're running a live benchmark and keeping the receipts.
Install
npx @deepseek-ai/dsh plugin --profile web add github:Psynosaur/dsh-token-gobbler
Then restart the harness. Or add "token-gobbler": "link:/path/to/token-gobbler" to the profile's
dependencies and "token-gobbler" to its dsh.profile.bundles, then pnpm install.
Usage
node bin/token-gobbler.js          # pretty report
node bin/token-gobbler.js --json   # machine-readable
node bin/token-gobbler.js --days N # time window
Web dashboard
Adds a Token Gobbler section to the DSH settings modal: a stack of collapsible drawers — 💰 Cost, 🪙 Tokens, ⚡ Speed, 📊 Activity, 📈 Chart defaults, 🔌 Imported sources — where each head carries the number that matters while the cards stay folded away. It holds the ↻ Refresh button plus a ♻ Reprocess button that clears the trajectory parse cache and re-parses every historic file. The activity modal (the 🦃 button, bottom right) has tabs: Overview, Cost, Performance, Runs (sessions grouped by the model that served them, one line per metric over the runs, like-for-like — a model is only ever compared against itself), Compare (pick 2–4 runs of any models out of a filterable list and read their per-step decode, prefill, step time and running output on one shared axis — by run progress or by elapsed runtime, so runs of different lengths line up), Daily (a GitHub-style calendar heatmap of token usage per day — hover a day for its combined stats, click to filter the per-session table to it), Llama Metrics (live llama.cpp server polling) and Settings (the rate cards).
Charts
Every chart is drawn by the plugin's own canvas engine (client/graph.ts +
client/graph-canvas.tsx) — no chart library is bundled, and none is injected into the host page.
Each chart opens in one of six plot modes, switched per chart above the plot: Lines, Both
(lines plus a dot per point), Dots (a scatter), Trend (a rolling median/mean/EMA through the
dots, the raw points left faint behind it), Bars (one bar per point, grown from the axis floor —
for discrete values like a day's cost) and Heat (one row per metric, one column per step, shaded
by value). Legend chips hide a whole group (a compaction window, a home), metric chips hide one
metric across every group, and the value axes rescale to whatever is left; hiding a metric is also how
you read two scales that differ by orders of magnitude. Which mode and which chips a chart opens with
are remembered per chart, and what they open with by default — plus how the lines themselves are
drawn (curved through the points or straight between them, how round the curve is, and whether Trend
mode's own rolling line is curved too) and how Trend and Heat behave — is set once in Settings ›
Token Gobbler › 📈 Chart defaults. Smoothing is monotone cubic (Fritsch–Carlson): the curve passes
through every step exactly and never overshoots between two of them, so a smoothed chart cannot show a
spike the data does not have.
Imported sources — other machines & other OSes
Your other boxes count too. Settings › Token Gobbler › 🔌 Imported sources registers ANOTHER
machine's DSH home and folds its sessions into every number — the Windows install on a mounted NTFS
volume (/media/<you>/<drive>/Users/<you>/.dsh), a macOS home on /Volumes, a nightly rsync of a
laptop's ~/.dsh, or just a copy of its sessions/ folder.
- Add — type the path (or hit 🔍 Scan for DSH homes, which probes
/mnt,/media/<you>,/run/media/<you>,/Volumesand your home for the shapes a DSH home takes). The layout is detected (a full home, thesessions/folder, a projection store, or a bare tree of trajectories) and the OS is read from the sessions' own cwds — a Windows session saysD:\models\…no matter where the drive is mounted today. - Marked, everywhere — every imported session carries its home's badge (🪟/🍎/🐧 + name) in the session tables and drawers, and the activity modal gets a chip row to filter every tab down to one home.
- Manage — ↻ Resync re-reads that home only (its cached parses are dropped; the rest of the dashboard keeps its warm cache), ⏸ Pause keeps it registered but out of the totals, ✕ Remove forgets the import (the files on that machine are never touched).
- Read-only and honest — the registry is
<your dsh home>/token-gobbler/sources.json; nothing is ever written into an imported home. A session id that exists in two homes is counted once (this machine wins), and a home with trajectories but no projection store still reports: its rows are rebuilt from the trajectory.
Turn outline & the event timeline
Every session drawer (Daily, Combined, Performance, Tokens, Sessions, Cost …) opens with a Turn outline & events section: one card per turn with its outcome badge (completed / in progress / aborted / blocked / error / max tokens / interrupted), the prompt, the response (or the tools a tool-only step called), the wall time and the step count — then that turn's compact event chips. Events that belong to no turn (the system prompt, the session title) sit on a session-level row. The per-turn → step table repeats the outcome badge and the first four event icons on each Turn header row.
Events come from the trajectory records the parser previously only tallied:
| chip | source record | example |
|---|---|---|
| ⚠ error | turn/end with a non-completed reason; failed compaction/end |
aborted — stopped by user |
| ■ user-stop | turn/end aborted by the user |
Turn stopped by user |
| ↻ retry | llm/retry |
Retry 1/5 · TRANSPORT: terminated (after 504ms) |
| ✋ approval | approval/asked + approval/decided |
Approval asked · bash — escalate sandbox… |
| ✂ compaction / prune | compaction/* |
Compaction summary — 3226 tokens shadowed |
| ☑ todo | todo/write |
Todo list written — 3 items |
| ⌘ command | command/done |
Command success: Compacted 54 history items |
| 🏷 title | session/title |
Session title: … (provider) |
| ⇄ model | model/selection |
Model → deepseek-v4-pro · … |
| 📦 deliverable | deliverables/presented |
Deliverables presented — 6 files |
| ⚙ system | system/message (v3) |
System prompt — 8466 chars |
A session whose trajectory has no turn records (older sessions) still shows its turns, derived from the step tree, without prompts.
Trajectory formats & shape snapshots
Token Gobbler reads DSH session trajectories from ~/.dsh/sessions/<workspace>/<session-id>/. DSH
has shipped two on-disk shapes, parsed by the same pass:
- v0 —
session.jsonl.zstd: one TOP-LEVEL record per streaming chunk (assistant/chunkwithchunk.typeusage/finish/…, plustext-chunks/tool-call-chunks/reasoning-chunks). The per-step tokens live in the usage chunk and the serving model inchunk.finish.replayState.response. - v3 —
session.v3.jsonl.zstd(current): the stream is NESTED inassistant/message.data.streamanddata.usagemirrors its usage chunk;finishno longer carriesreplayState(the model is onmessage.source), the system prompt moved fromrequest/headerto asystem/messagerecord, and the header gainedisSeeded. A directory holding both files parses the v3 copy only.
Because a format change used to look identical to "the numbers went to zero", every parse also records the SHAPE of what it read. Snapshot it and diff an upgrade against it:
npm run report:shape                                       # shape of what is on disk right now
node scripts/trajectory-shape.js --out docs/trajectory-shapes.md
node scripts/trajectory-shape.js --compare docs/trajectory-shapes.md
# exit 0 = the format did not move; exit 1 = a record type / field / value set / stream kind changed
The manifest is Markdown for reading and carries the machine-readable snapshot in a fenced block.
See lib/trajectory.ts (the "FORMAT VERSIONS" header) for the field-level differences.
Pricing
cost = (uncachedInput·input + output·output + cacheRead·cacheRead + cacheWrite·cacheWrite) / 1e6
| Model | Kind | $/M in | $/M out | $/M cacheR | $/M cacheW |
|---|---|---|---|---|---|
| Claude Opus 4.6 | corp | 5.00 | 25.00 | 0.50 | 6.25 |
| Claude Sonnet 4.6 | corp | 3.00 | 15.00 | 0.30 | 3.75 |
| Claude Sonnet 5 (est.) | corp | 3.00 | 15.00 | 0.30 | 3.75 |
| Grok 4.6 (est.) | corp | 3.00 | 15.00 | 0.30 | 3.75 |
| DeepSeek V4 Flash (API) | corp | 0.44 | 1.32 | 0.014 | 0 |
| DeepSeek V4 Pro (API) | corp | 1.32 | 3.96 | 0.044 | 0 |
| Qwen 3.8 27B (local) | local | 0.25 | 2.50 | 0.05 | 0.3125 |
Pricing is table-driven: a model prices under its own entry, family fallbacks resolve for unseen
self-hosted models, and the first table is seeded from the trajectory (known models prefilled with
their real rates). Every entry carries a kind — corp (billed, in the company bucket) or
local (the home lab, priced at its configured rates). Edit lib/pricing.ts, or the Pricing tab
(saved to ~/.dsh/token-gobbler/pricing.json), where you set each model's kind, its rates, and the
★ WFH reference model without touching code.
Build
npm install     # one-time: esbuild + typescript
npm run build   # build:lib (tsc lib/*.ts -> lib/*.js) + build:client (esbuild -> lib/client.js)
npm run typecheck
npm test        # builds lib/*.js, then runs the node --test suite
Edit the .ts sources, never the generated .js.
Layout
client/*.ts(x)     web dashboard (TypeScript, bundled by esbuild)
client/graph.ts    the canvas chart engine every chart is drawn by (dependency-free)
lib/index.ts       host: /token-gobbler/* routes
lib/trajectory.ts  zstd trajectory reader/parser (v0 + v3) + shape capture
lib/projcache.ts   projection-store reader
lib/sources.ts     imported DSH homes: registry, layout + OS detection, scanning
lib/pricing.ts     rate cards + cost math
lib/report.ts      aggregate + attribution + pricing
lib/client.js      GENERATED (esbuild); do not edit
bin/token-gobbler.js  CLI (pretty/--json/--days/--breakdown)
scripts/trajectory-shape.js  trajectory shape snapshot/diff CLI
docs/trajectory-shapes.md    the pinned shape manifest (`npm run report:shape`)
test/report.test.js   node --test suite (plus sources / trajectory / drawers / graph / settings /
                      llama-metrics)
MIT. Not affiliated with any turkey, corp, or token ledger. The gobbler does not eat your tokens — it audits them.
No comments yet. Be the first to write one.