
PriRex Monitor
GPU · CPU · VRAM · power · energy · token speed · context fill — live telemetry for DeepSeek Harness, on one page.



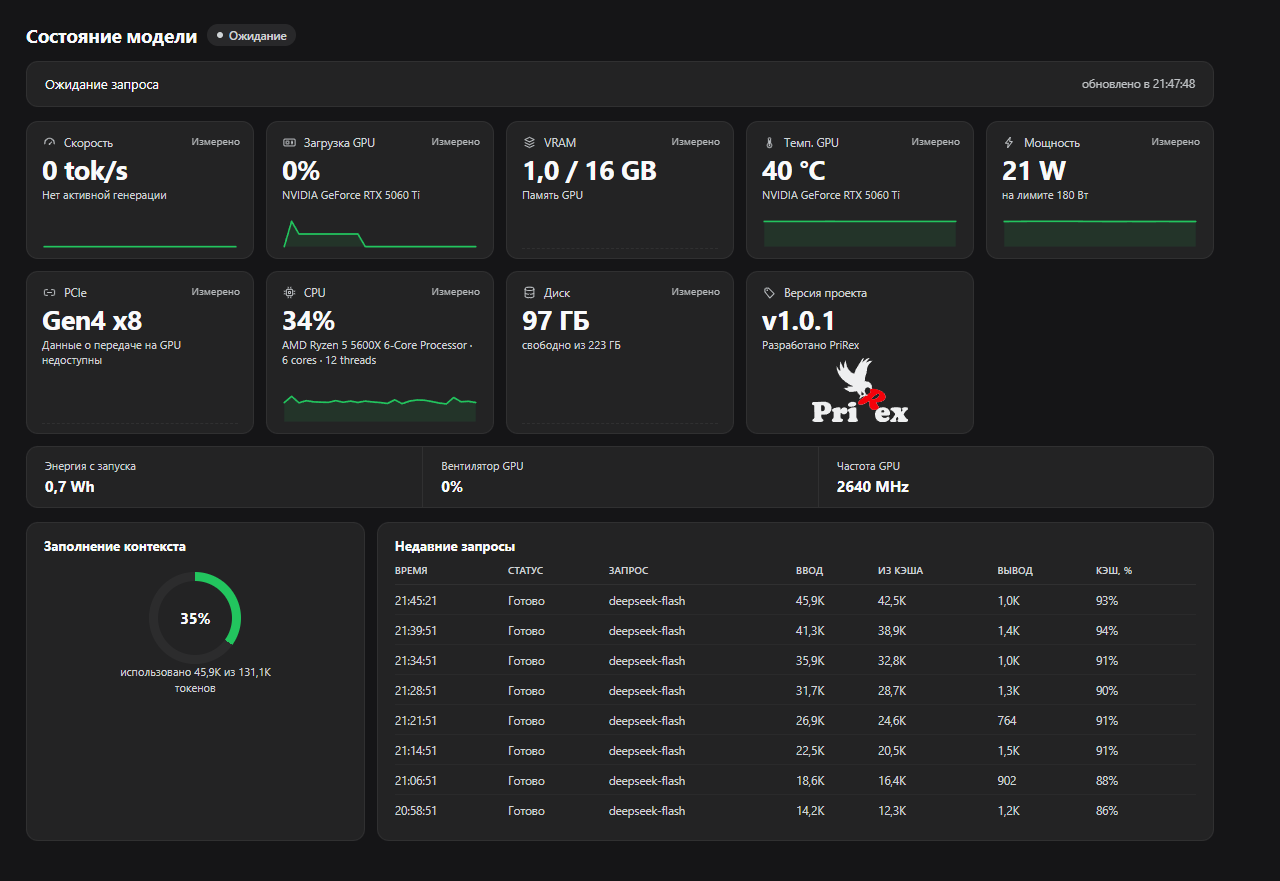
The page: hardware cards, context ring and the last requests. Hardware numbers are read from the machine; the token rows come from a demo session.
English
Overview
PriRex Monitor adds a Monitor entry to the DSH sidebar plus a full telemetry page in the main panel. The host half samples the machine on a fixed interval, accumulates token usage from the session event stream, and publishes the snapshot two ways: a JSON route and an SSE stream that keeps the page live without polling.
| Half | File | Role |
|---|---|---|
| Host | index.js |
samples sensors, accumulates token usage, serves two local routes |
| Browser | client.js (built from client.template.js) |
sidebar entry + page, React.createElement only, styled with host theme tokens |
What the page shows
| Card | Content |
|---|---|
| Speed | tokens/s of the session; 0 tok/s means the model is idle |
| GPU load | utilization %, with a 40-point sparkline |
| VRAM | used / total GB |
| GPU temperature | °C — the sparkline turns warning-colored above the configured threshold |
| Power | draw / limit, W |
| PCIe | link generation and width (Gen4 x16) |
| CPU | total load % |
| Disk | read throughput (B/s) where the platform reports it; on Windows, which has no byte-rate provider, it shows free space of the system volume |
Below the cards: energy since host start (Wh, integrated from GPU power draw), GPU fan (%), GPU clock (MHz), a context fill ring (used / window tokens) and a recent requests table — time, status, model, input tokens, cache-read tokens, output tokens, cache share.
GPU numbers come from nvidia-smi, because systeminformation does not expose utilization, fan
speed or PCIe link width on Windows. Without an NVIDIA tool the module falls back to
systeminformation, so AMD/Intel machines still get load, temperature, power and VRAM.
Why PriRex Monitor
- Real sensors, not guesses —
nvidia-smireports what the driver knows: utilization, VRAM, fan, power draw against the limit, temperature, SM clock and the PCIe link; every other platform falls back tosysteminformationinstead of showing nothing. - One page instead of three tools — hardware, the context window and the cost of the current session sit together, so a slow answer can be explained without leaving the chat.
- Live, not polled — samples arrive over SSE every 500 ms; the page falls back to a 2 s poll only if the stream is unavailable.
- Zero setup — no config file to write, no build during installation (
client.jsis committed), no service to run; the plugin samples the machine it is already installed on. - Local by design — two same-origin
GETroutes, no outbound traffic, no filesystem access, and anvidia-smicall with a fixed argument vector. - Fits the host — colors come from DSH theme tokens, so the page matches light and dark themes without a second stylesheet.
Installation
Requirements: DeepSeek Harness with the Web surface, Node.js ≥ 20.
From GitHub — Plugins → Install bundle → GitHub and use the repository name
Prirex/PriRex-Monitoring-DeepSeek-Harness. client.js is committed, so nothing is built during
installation.
From a local folder — Plugins → Install bundle → local path and point it at this folder. DSH
links it with a directory junction at node_modules/prirex-monitoring-deepseek-harness.
These two routes must not occupy the same slot at once. If a local link is still in place and you then install the GitHub version, pnpm cannot replace the junction and fails with
[ERR_PNPM_EPERM] importPackage. Close DSH and drop the link first — only the junction is removed, the project folder stays intact:cmd /c rmdir "%USERPROFILE%\.dsh\profiles\desktop\node_modules\prirex-monitoring-deepseek-harness"
The bundled cordis.patch.yml inserts the prirex-monitor row automatically, so
no manual patch editing is required.
Configuration
Defaults live in index.js; override them in the profile's cordis.patch.yml:
- id: prirex-monitor
  name: prirex-monitoring-deepseek-harness
  config:
    refreshMs: 500              # sampling interval, floored at 200 ms
    overheatC: 80               # temperature that turns the sparkline warning-colored
    ratesUsdPerMillion:         # used for tokens.costUsd in the JSON snapshot
      input: 0.27
      output: 1.1
HTTP routes
Registered on the DSH web server, both local-only by design:
| Route | Format | Notes |
|---|---|---|
/api/prirex-monitor/telemetry |
JSON snapshot | GET / HEAD only |
/api/prirex-monitor/stream |
SSE | pushes every fresh sample, retry: 2000 hint |
The client consumes the stream and falls back to polling the JSON route every 2 s when the stream is unavailable.
Security
GET/HEADonly (405otherwise);Originmust matchHost;Sec-Fetch-Site: cross-siteis rejected — all403.- No outbound network traffic, no filesystem access, no shell:
nvidia-smiis spawned with a fixed argument vector. - Telemetry updates are wrapped so a failure can never disturb session commits.
Details and the reporting process: SECURITY.md.
Project layout
index.js               host half: sensors, token accounting, HTTP routes
client.template.js     browser half source (React.createElement, no JSX)
client.js              built artifact — committed, edit the template instead
scripts/gen-client.mjs build step: template -> client.js
scripts/smoke-client.mjs  evaluates client.js in a stubbed loader
cordis.patch.yml       loader patch that inserts the plugin row
locale/                panel metadata (ru, en)
icon.svg               sidebar and page icon
Development
pnpm install
pnpm run build   # node scripts/gen-client.mjs
pnpm run smoke   # evaluates client.js and checks the registration contract
pnpm run check   # build + smoke
Edit client.template.js, never client.js: the build copies the template verbatim and the smoke
test fails on a stale artifact.
License
MIT — see LICENSE.
Русский
Описание
PriRex Monitor добавляет в боковую панель DSH пункт Монитор и открывает полноценную страницу телеметрии в центральной панели. Хост-часть опрашивает железо с фиксированным интервалом, накапливает расход токенов из потока событий сессии и отдаёт снимок двумя способами: JSON-маршрутом и SSE-потоком, который обновляет страницу без опроса.
| Часть | Файл | Роль |
|---|---|---|
| Хост | index.js |
опрос датчиков, учёт токенов, два локальных маршрута |
| Браузер | client.js (собирается из client.template.js) |
пункт меню и страница, только React.createElement, оформление на токенах темы |
Что показывает страница
| Карточка | Содержимое |
|---|---|
| Скорость | токенов/с текущей сессии, по приращению между замерами |
| Загрузка GPU | процент загрузки и спарклайн на 40 точек |
| VRAM | занято / всего, ГБ |
| Темп. GPU | °C — спарклайн подсвечивается при превышении настроенного порога |
| Мощность | потребление / лимит, Вт |
| PCIe | поколение и ширина линии (Gen4 x16) |
| CPU | суммарная загрузка, % |
| Диск | скорость чтения (Б/с) там, где платформа её отдаёт; на Windows, где провайдера байт/с нет, показывается свободное место системного тома |
Ниже карточек: энергия с запуска хоста (Вт·ч, интеграл мощности GPU), вентилятор GPU (%), частота GPU (МГц), кольцо заполнения контекста (использовано / окно) и таблица недавних запросов — время, статус, модель, ввод, из кэша, вывод, доля кэша.
Данные GPU читаются через nvidia-smi: systeminformation не отдаёт загрузку, обороты вентилятора
и ширину PCIe. Без NVIDIA-инструмента модуль переходит на systeminformation, поэтому на
AMD/Intel всё равно видны загрузка, температура, мощность и VRAM.
Преимущества
- Настоящие датчики, а не оценки —
nvidia-smiотдаёт то, что знает драйвер: загрузку, VRAM, вентилятор, потребление к лимиту, температуру, частоту SM и линию PCIe; на остальных платформах работает откат наsysteminformation, а не пустая карточка. - Одна страница вместо трёх утилит — железо, окно контекста и стоимость текущей сессии рядом, поэтому медленный ответ объясняется без выхода из чата.
- Живые данные, а не опрос — замеры приходят по SSE каждые 500 мс; опрос раз в 2 с включается только если поток недоступен.
- Без настройки — не нужно писать конфиг, собирать при установке (
client.jsзакоммичен) и держать отдельный сервис: плагин читает машину, на которой уже установлен. - Локально по замыслу — два same-origin
GET-маршрута, нет исходящего трафика, нет доступа к файловой системе,nvidia-smiвызывается с фиксированным набором аргументов. - Под стиль хоста — цвета берутся из токенов темы DSH, поэтому страница совпадает со светлой и тёмной темой без второго набора стилей.
Установка
Требования: DeepSeek Harness с веб-интерфейсом, Node.js ≥ 20.
С GitHub — Плагины → Установить бандл → GitHub, репозиторий
Prirex/PriRex-Monitoring-DeepSeek-Harness. client.js закоммичен, при установке ничего не
собирается.
Из локальной папки — Плагины → Установить бандл → локальный путь и указать эту папку. DSH
подключает её junction-ссылкой node_modules/prirex-monitoring-deepseek-harness.
Оба способа не должны занимать одно место одновременно. Если локальная ссылка уже стоит, а вы ставите версию с GitHub, pnpm не может заменить junction и падает с
[ERR_PNPM_EPERM] importPackage. Закройте DSH и сначала уберите ссылку — удаляется только junction, папка проекта остаётся на месте:cmd /c rmdir "%USERPROFILE%\.dsh\profiles\desktop\node_modules\prirex-monitoring-deepseek-harness"
Входящий в комплект cordis.patch.yml сам вставляет строку prirex-monitor —
править патч вручную не нужно.
Настройки
Значения по умолчанию заданы в index.js, переопределяются в cordis.patch.yml профиля:
- id: prirex-monitor
  name: prirex-monitoring-deepseek-harness
  config:
    refreshMs: 500              # интервал опроса, минимальное значение — 200 мс
    overheatC: 80               # температура, при которой спарклайн становится предупреждающим
    ratesUsdPerMillion:         # используются для tokens.costUsd в JSON-снимке
      input: 0.27
      output: 1.1
HTTP-маршруты
Регистрируются на веб-сервере DSH, оба локальные по замыслу:
| Маршрут | Формат | Замечания |
|---|---|---|
/api/prirex-monitor/telemetry |
JSON-снимок | только GET / HEAD |
/api/prirex-monitor/stream |
SSE | присылает каждый свежий замер, подсказка retry: 2000 |
Клиент читает поток, а если поток недоступен — опрашивает JSON-маршрут раз в 2 секунды.
Безопасность
- Только
GET/HEAD(иначе405);Originдолжен совпадать сHost; запросы сSec-Fetch-Site: cross-siteотклоняются — во всех случаях403. - Нет исходящего трафика, нет доступа к файловой системе, нет оболочки:
nvidia-smiзапускается с фиксированным набором аргументов. - Обновление телеметрии обёрнуто так, что сбой не может помешать фиксации сессии.
Подробности и порядок сообщения о проблемах: SECURITY.md.
Структура проекта
index.js               хост-часть: датчики, учёт токенов, HTTP-маршруты
client.template.js     исходник браузерной части (React.createElement, без JSX)
client.js              собранный артефакт — закоммичен, править нужно шаблон
scripts/gen-client.mjs шаг сборки: шаблон -> client.js
scripts/smoke-client.mjs  прогоняет client.js в заглушке загрузчика
cordis.patch.yml       патч загрузчика, вставляющий строку плагина
locale/                метаданные панели (ru, en)
icon.svg               иконка для панели и страницы
Разработка
pnpm install
pnpm run build   # node scripts/gen-client.mjs
pnpm run smoke   # прогоняет client.js и проверяет контракт регистрации
pnpm run check   # сборка + smoke
Правьте client.template.js, а не client.js: сборка копирует шаблон как есть, а smoke-тест падает
на устаревшем артефакте.
Лицензия
MIT — см. LICENSE.
No comments yet. Be the first to write one.