dsh-usage-monitor
English | 中文
Usage dashboard for DeepSeek Harness. It folds provider-reported token usage out of session logs and charts it in Settings.
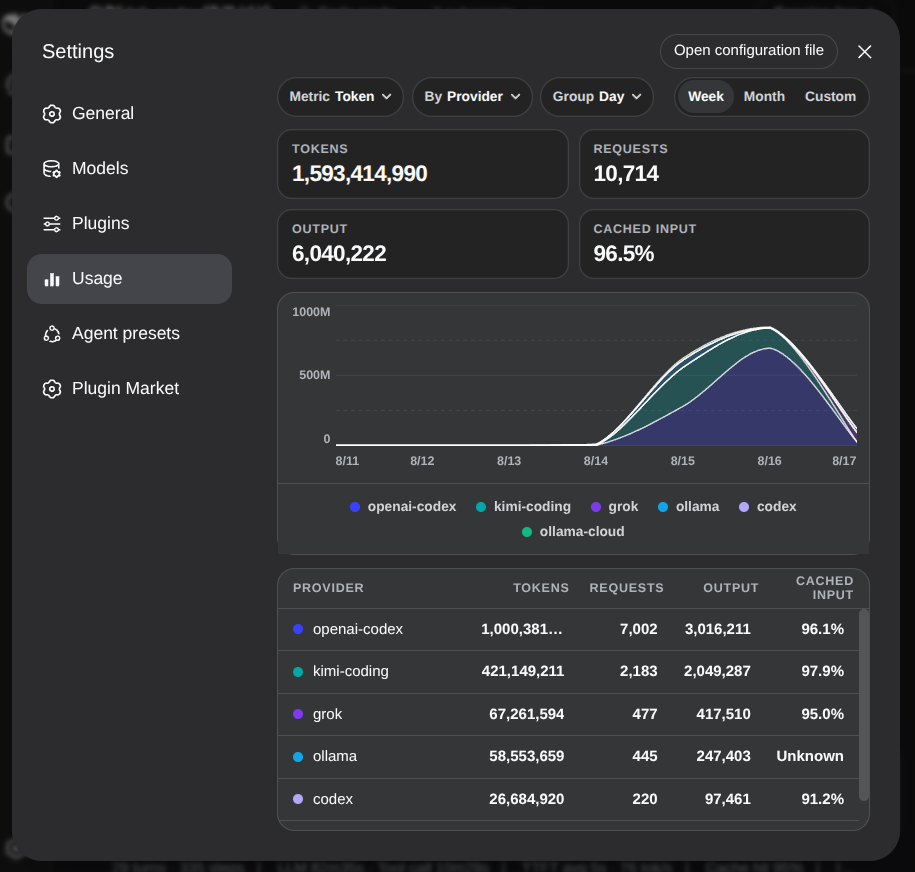
What it shows
- Tokens, requests, output tokens, and cache-hit rate
- Stacked chart with Metric (token / request), By (provider / model / workspace), Group (day / week)
- Week, month, and custom ranges
- A breakdown table that follows the current By grouping
Subscription quotas are not fetched.
Installation
DeepSeek Harness 0.1.0-rc.6 or later is required. Install directly from GitHub:
dsh plugin --profile web add github:NOirBRight/dsh-usage-monitor#v0.2.4
dsh web
The repository tracks release-ready lib artifacts, so GitHub installation needs no build-script allowlist. A source checkout can use a link installation after running pnpm run build.
Then open Settings → Usage.
Data
Reads ctx.sessionQuery (live + persisted sessions). Does not scan session.jsonl.zstd itself and does not read leftover community cache files.
The Host opens a plugin-owned SQLite sidecar at startup but does not list or read session history until the first Usage query. Each query reconciles every potentially relevant missing or changed session before it returns; a relevant source or database error fails the query instead of serving stale or partial data. Raw JSONL is folded one line at a time, and completed projection batches remain durable if a later batch is interrupted.
The sidecar uses WAL, synchronous=NORMAL, and a bounded busy timeout. Source reads and SQLite transactions default to one session and eight sessions respectively. The validated plugin configuration exposes projectionWarmup: on-demand, projectionReadConcurrency, and projectionTransactionBatchSize; the default values are on-demand, 1, and 8. A Loader entry may omit config to use those defaults; an explicit invalid config fails during plugin load.
Run pnpm run benchmark:projection for the synthetic 1,346-session / 83,883-step workload. It reports cold and warm latency, heap delta, source reads, and peak read concurrency without reading production data. See the projection decision for guarantees and expected metrics.
No comments yet. Be the first to write one.