dsh-schematic
One control plane for humans and agents running DeepSeek Harness.



English · 简体中文
Your agent is not a black box. It is a live graph of models, tools, memory, policy, workflows, and the services connecting them. Humans need to see and shape that graph; agents need safe, typed ways to operate it.
dsh-schematic gives both operators the same control plane. People get a full-screen visual workspace. Agents get native dsh tools for the same persistent operations. Both work from the same live state, validation rules, previews, backups, and guarded write pipeline.
dsh plugin --profile web add dsh-schematic
dsh web
# open http://127.0.0.1:3080/schematic
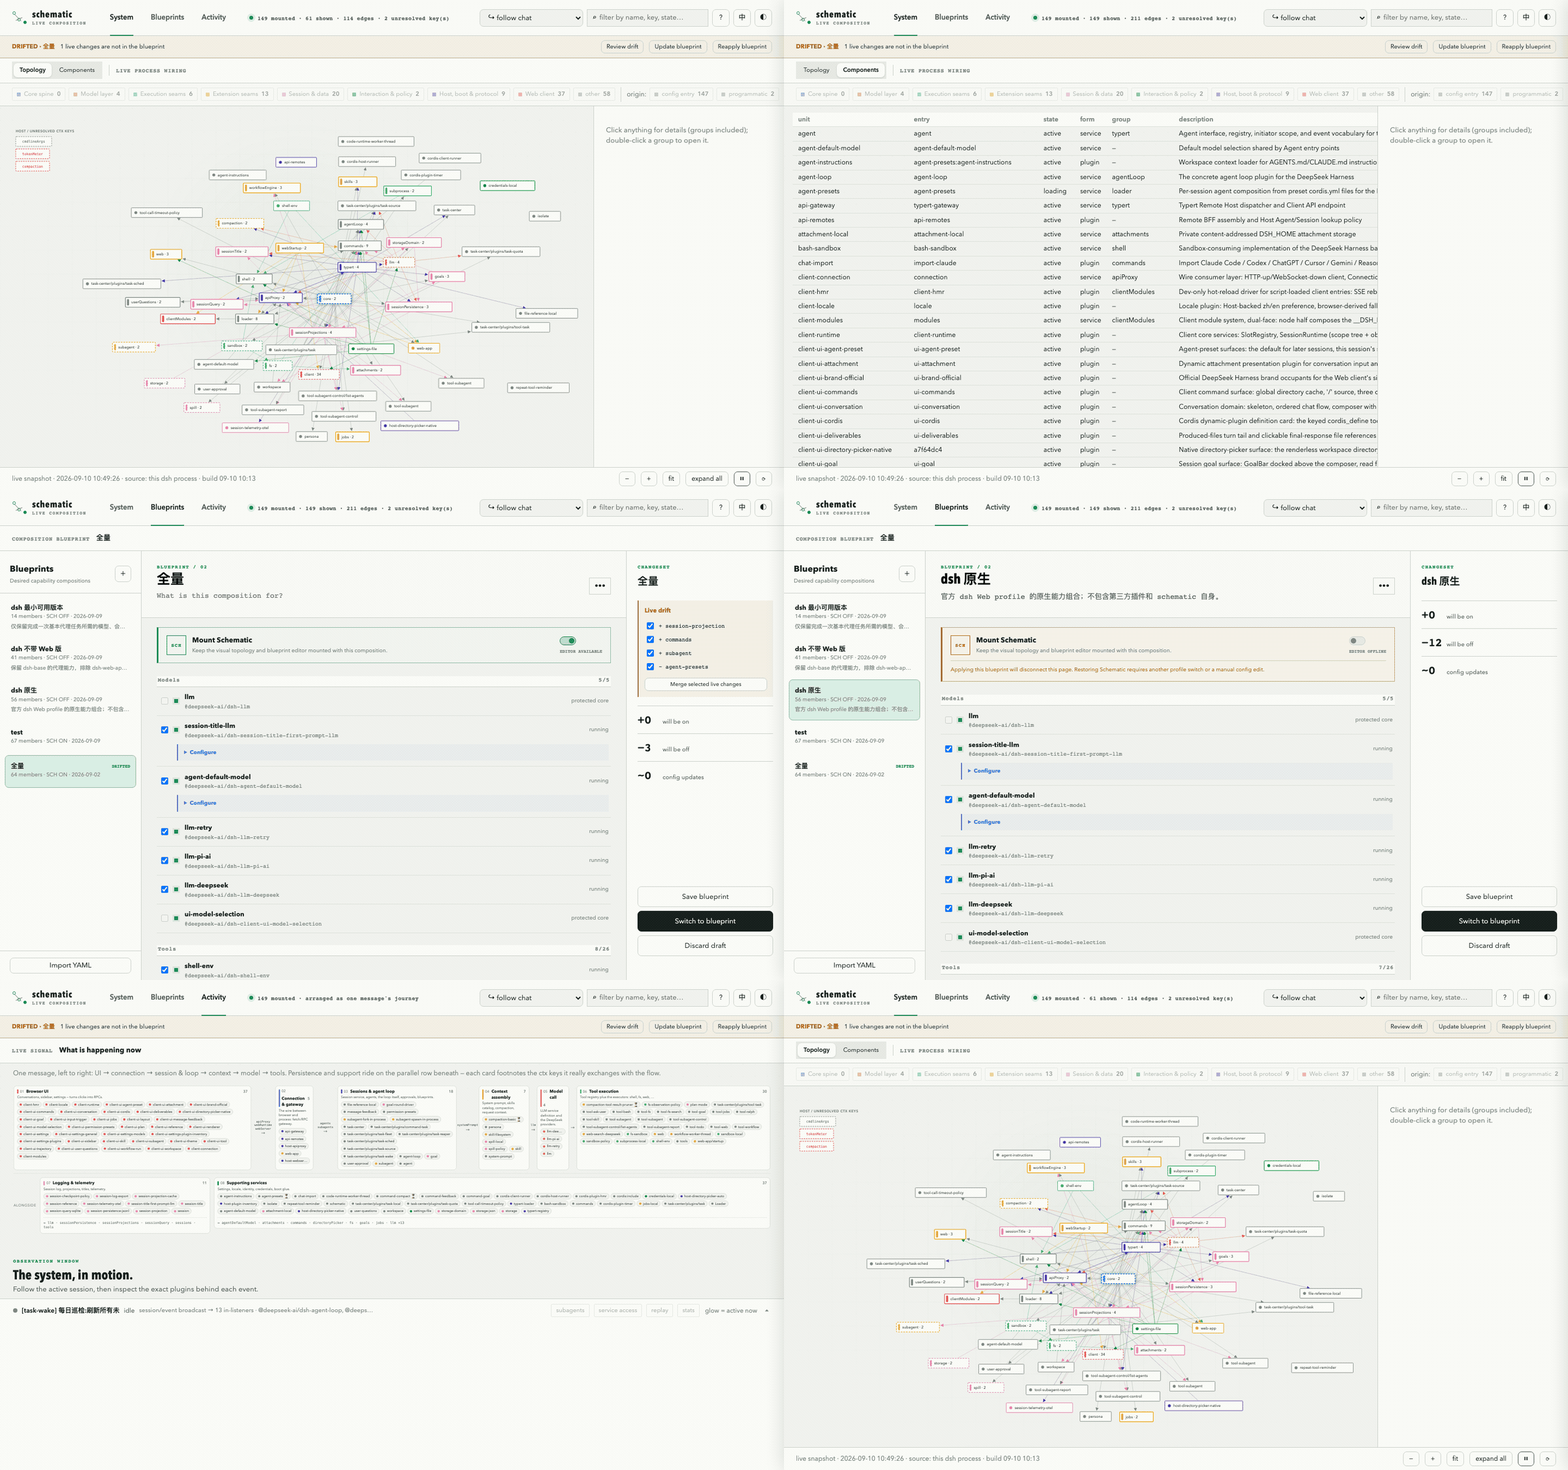
One system, two operators
| Human operator | Agent operator | Shared foundation |
|---|---|---|
| Explore topology, edit blueprints, arrange Activity, and review every change visually. | Inspect, compose, switch, organize, and recover through schematic_* tools in conversation. |
One runtime graph, one set of stores, one validation model, and the same safety boundaries. |
Every persistent action exposed to a person has a model-facing counterpart. This is not a separate “AI automation mode”: humans and agents can hand work back and forth without translating intent into a second configuration system.
Three workspaces, three questions
| Workspace | The question it answers | What you can do |
|---|---|---|
| System | What is my agent made of right now? | Explore the live topology or inventory, inspect dependencies, configure plugins, toggle entries, and replace providers. |
| Blueprints | How do I make this setup repeatable? | Compose by capability, save local drafts, import/export YAML, review drift, and switch whole plugin combinations safely. |
| Activity | What just happened—and who did it? | Follow session events and request journeys, arrange signals into your own groups and lanes, filter noise, and inspect failures or latency. |
The result is part observability console, part composition workbench: a place to understand the system before changing it.
Why it feels different
- The graph is the interface. Select a node or seam and act in context instead of hunting through unrelated YAML files.
- Activity follows ownership. Model calls, tool runs, workflows, registry changes, and failures are attributed to the plugin responsible for them.
- Blueprints describe capabilities, not brittle snapshots. Save a positive member list, decide how newcomers should behave, and explicitly choose whether a blueprint mounts Schematic itself.
- Every risky change earns a preview. You see structural warnings, member diffs, and the exact managed-block YAML before anything is written.
- It stays readable under pressure. Event storms are folded into counted rows, internal service-read noise is suppressed, and motion respects
prefers-reduced-motion. - English and 中文 are first-class. The app translates plugin descriptions through the host's configured model route while keeping identifiers intact.
- Human and agent actions stay symmetrical. The UI and
schematic_*tools share the same plans, validation, confirmation gates, backups, and stale-state protection.
Editing without crossing your fingers
Every mutation follows one guarded pipeline:
select change → compute diff → dry-run composition → review warnings
              → backup full patch → atomic write → verify hot reload
              → success, or automatic rollback
Schematic writes only a clearly marked managed block in the active profile's cordis.patch.yml, plus its own data under ~/.dsh/schematic/. It never rewrites bundle layers, manifests, session logs, or the profile root configuration. If the source file changes underneath a pending edit, the write stops instead of overwriting it.
Editing is off by default and can be disabled entirely with config.edit.enabled=false. Below 768 px, every workspace remains browsable while writes are disabled.
Blueprints that survive reality
A blueprint is not a frozen copy of the entire plugin tree. It stores the optional members you want, their configuration, the world they were saved against, and whether Schematic should remain mounted.
That distinction lets a blueprint survive harness upgrades:
- new plugins are surfaced as unmanaged entries and require an explicit keep / disable / adopt decision;
- renamed or rebound packages are reported instead of silently modified;
- missing packages block the switch and show the install command;
- protected core stays outside blueprint membership, with only the dedicated Schematic mount switch as an explicit exception;
- drift is computed from the same materialization plan used for switching, so “current” means there is genuinely nothing left to apply.
Blueprints live as readable schema-2 YAML under ~/.dsh/schematic/blueprints/. Existing schema-1 presets migrate idempotently and remain untouched as a read-only backup.
The Agent uses the same control plane
dsh-schematic registers model-facing tools for every persistent UI action; Activity arrangement remains available even when composition editing is disabled:
schematic_plugins— inspect the composition tree and available capabilities;schematic_blueprint_list— list blueprints and current drift;schematic_blueprint_save/schematic_blueprint_switch— curate, save, preview, back up, and safely switch;schematic_blueprint_manage— inspect, duplicate, rename, update, import/export, adopt unmanaged entries, or delete;schematic_system_compose— inspect, preview, apply, roll back, or clear live composition changes;schematic_activity_layout— collaboratively arrange Activity groups, order, lanes, descriptions, colors, and plugin membership.
So “save me a lean coding setup, switch to it, and group its runtime signals by responsibility” can be a conversation—not a scavenger hunt through config files. The Agent can inspect first, present the same preview a person would review, ask for confirmation where required, and leave the result ready for visual inspection.
More of what shipsLive topology
- Zoomable, pannable, clustered dependency graph sourced from the loader's running plugin tree.
- Shared search, capability, and status filters across topology and inventory views.
- Context panels for status, capabilities, dependencies, origin, recent activity, configuration, provider replacement, and blueprint membership.
- Failure propagation from internal fibers to their visible plugin unit, with recovery on the next settled graph.
- A draggable, resizable composer-side star map that lights real consumer → provider service lanes.
Runtime activity
- Session-aware live events, subagent/background filtering, request journeys, replay, and plugin statistics.
- Ownership attribution for model replies, tool calls, workflows, host actions, registry changes, background jobs, and failures.
- Counted-row coalescing and trailing attribution rebuilds keep host-side bursts from turning the observer into the hot path.
Composition workbench
- Enable/disable plugins, edit config, and swap a seam's provider in context.
- Ghost previews on the graph, per-entry diffs, exact YAML line diffs, and structure-aware warnings.
- Harness-native dry-run, timestamped backup, atomic managed-block write, hot reload verification, and rollback.
- Light/dark themes, semantic controls, keyboard navigation, visible focus, ARIA, and reduced-motion support.
Requirements
| Component | Supported |
|---|---|
| DeepSeek Harness | >=0.1.0-rc.8, web profile |
@deepseek-ai/cordis |
^4.0.1 |
@deepseek-ai/cordis-plugin-include |
^1.0.6 |
| Browser | Current Chromium, Firefox, or Safari |
| Node.js | >=22.19 when building from source; CI covers Node 22 and 24 |
Install and update
The package is a dsh bundle, so the official plugin command installs the dependency and registers it with the selected profile:
# install
dsh plugin --profile web add dsh-schematic

# update
dsh plugin --profile web update dsh-schematic

# remove
dsh plugin --profile web remove dsh-schematic
Restart the profile after installation and open /schematic. You also get a Plugin topology section in Settings and the composer-side star map. Other profiles use the same commands with their profile name.
Architecture
The package contains two cooperating halves:
- Host plugin — reads the Cordis loader tree, subscribes to runtime activity, exposes the live graph and SSE/JSON endpoints, registers blueprint tools, and owns the guarded composition pipeline.
- Browser application — the standalone System / Blueprints / Activity interface plus the Settings integration and composer-side star map. It has no runtime framework dependency; the shipped bundles are built with esbuild.
The topology represents dependency injection, not dataflow. It shows the settled static equivalent of the running Cordis system—the practical UI counterpart to the resting-state result described in the Cordis paper, A Programming Paradigm for Spatiotemporal Composability.
Development
npm install
npm run check
npm run check runs TypeScript validation, the Node test suite, and all production builds. See CONTRIBUTING.md for bug-report and pull-request guidance, and CHANGELOG.md for the version-by-version history.
Roadmap
- Seam-aware supply panel: discover providers from the capability edge where they are needed.
- Install hand-off for missing blueprint members.
- Deeper activity queries without turning Schematic into a conversation-replay product.
If dsh-schematic makes your agent easier to understand, debug, or trust, consider giving the repository a ⭐. It helps other DeepSeek Harness builders find the project.
No comments yet. Be the first to write one.