dsh-token-usage-panel



在 DeepSeek Harness 的「设置」里看每天花了多少 Token。 不用离开 DSH,也不用另开网页:设置 →
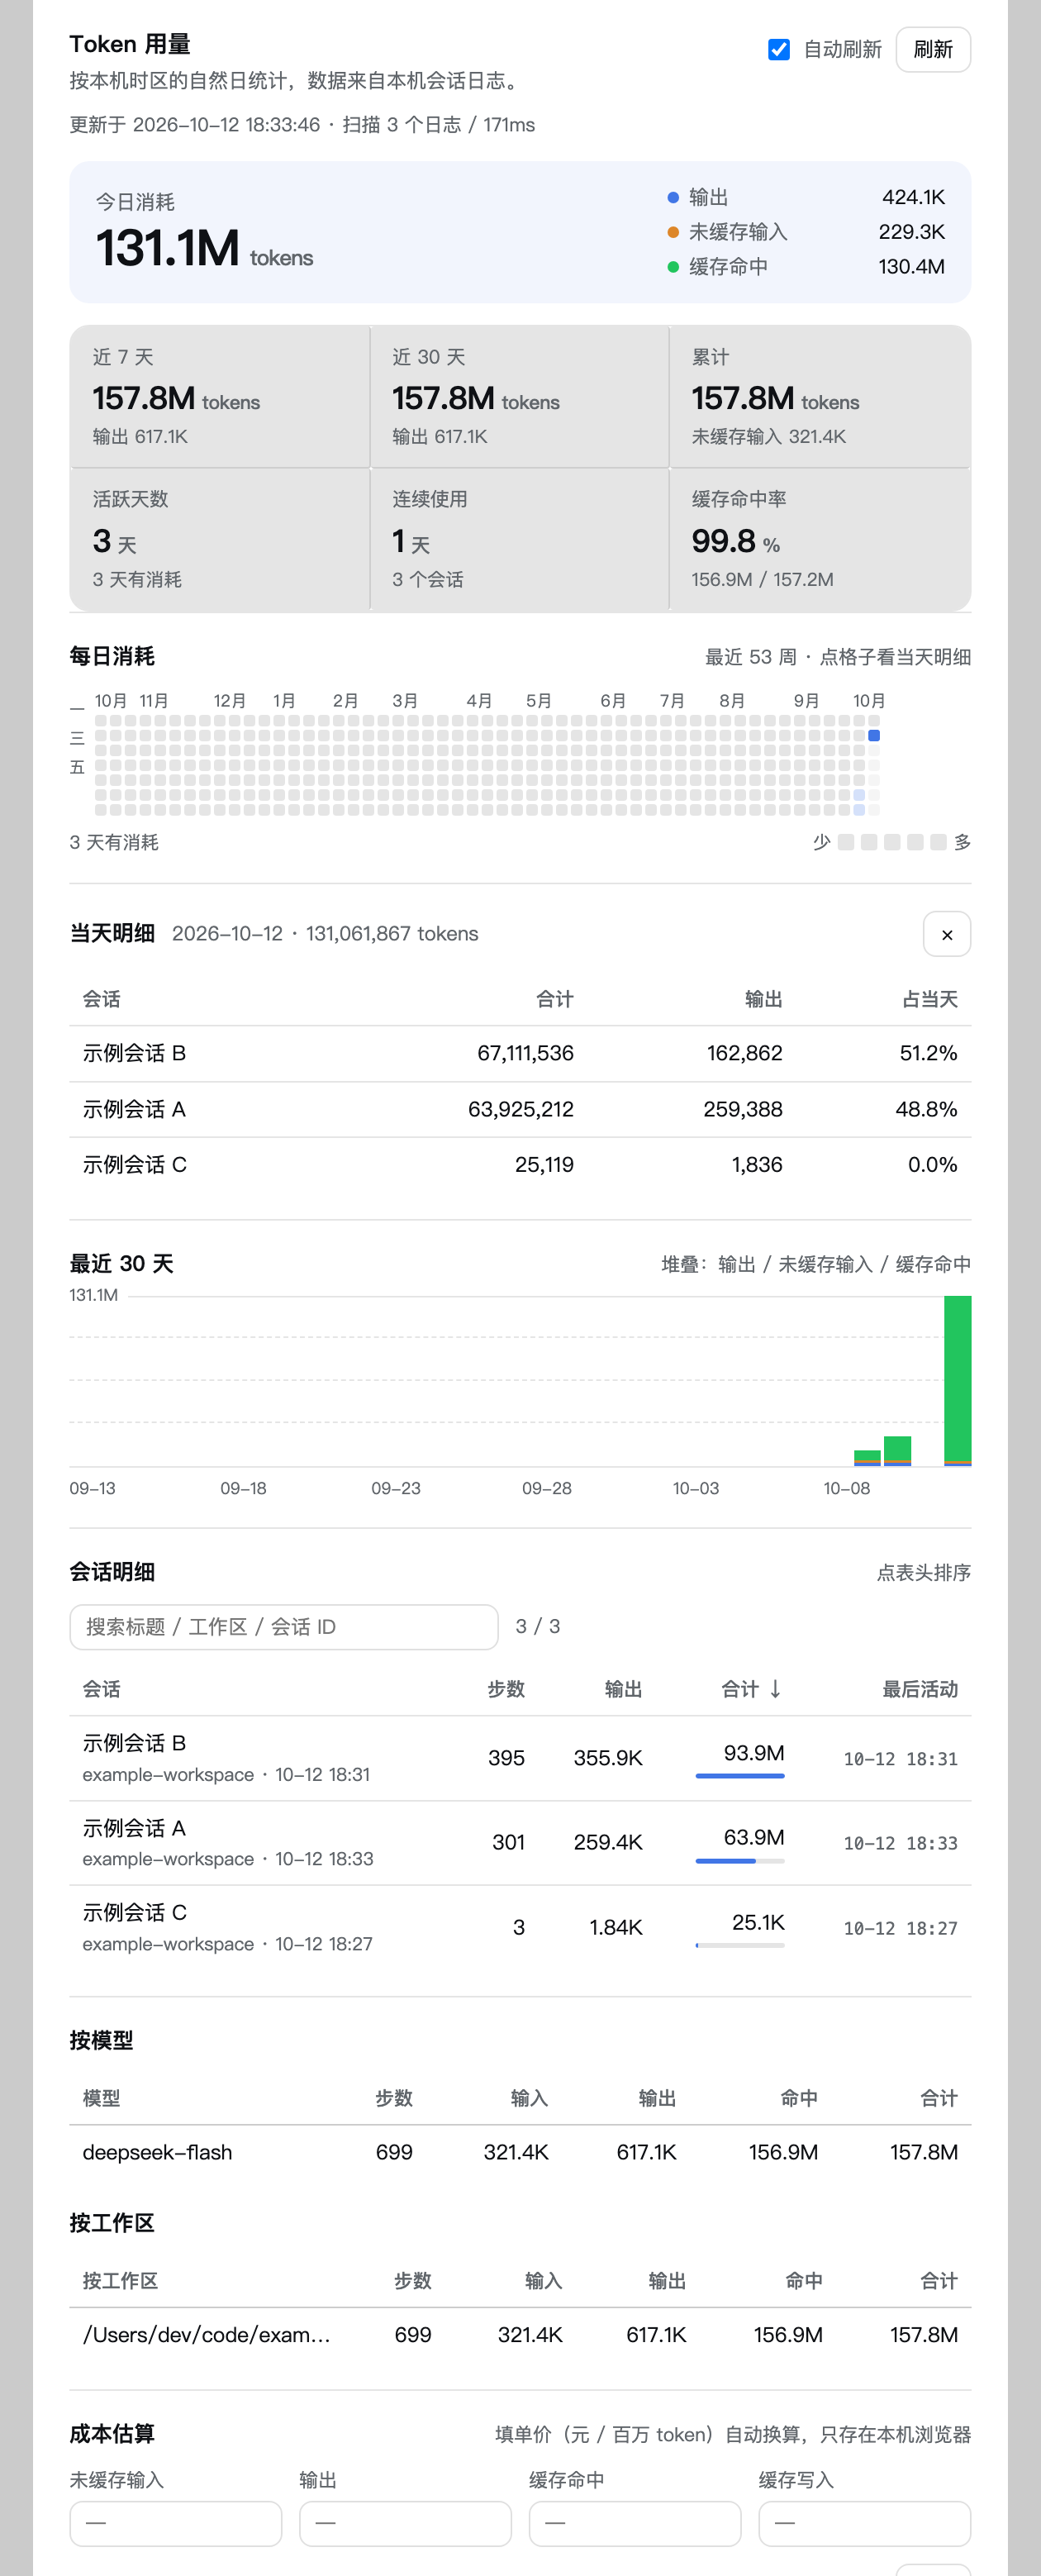
Token 用量,就是一张 GitHub 风格的每日消耗热力图。
浅色主题:
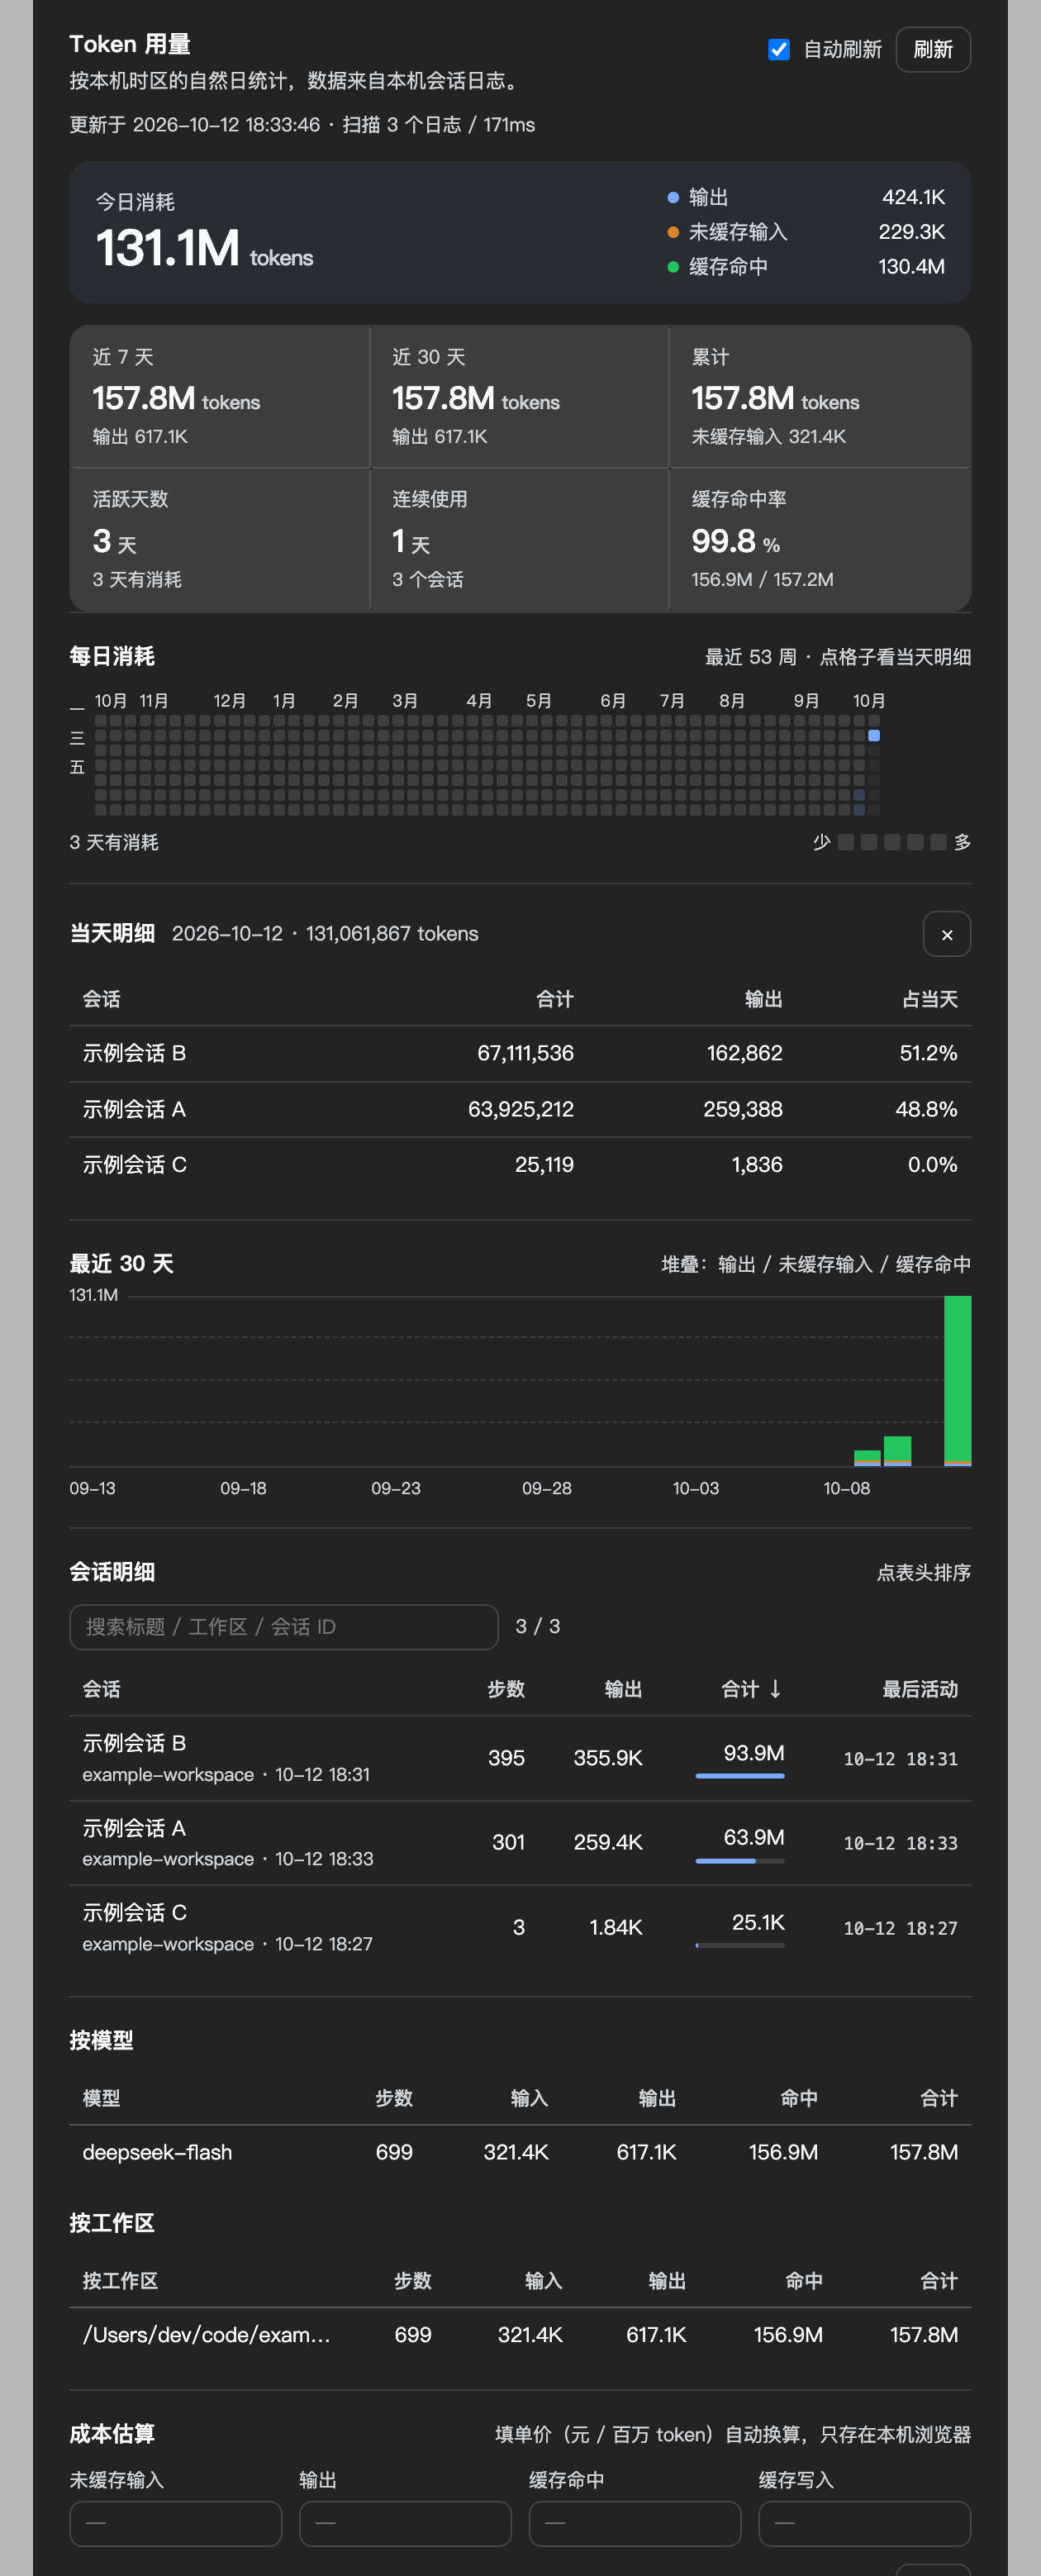
深色主题:
功能
- 今日消耗:总量,加上「输出 / 未缓存输入 / 缓存命中」三色明细;填了单价还会显示当天估算金额。
- 指标网格:近 7 天、近 30 天、累计、活跃天数、连续使用天数、缓存命中率。
- 每日消耗热力图:最近 53 周,GitHub 贡献图那种;颜色越深=当天消耗越多。 悬停看当天四类 token 明细,点格子展开「当天明细」(当天各会话的占比)。
- 最近 30 天趋势:输出 / 未缓存输入 / 缓存命中 的堆叠柱状图,带网格线和峰值刻度。
- 会话明细:可排序、可搜索;窄面板自动精简列,宽面板额外显示工作区、缓存命中和 30 天迷你条。
- 按模型 / 按工作区汇总。
- 成本估算:填单价(元 / 百万 token)自动换算金额;价格只存在你本机浏览器里。
界面完全使用 DSH 自己的设计变量(--dsw-alias-*),浅色 / 深色主题自动适配;
面板宽度会随设置面板变化(实测 ~590px 也能完整放下 53 周热力图)。
安装
需要已安装 DeepSeek Harness(Web 或桌面版),且能正常使用
dsh命令。
方式 A:在 DSH 里点几下(推荐)
打开 DSH 侧边栏的 插件(Plugins) 页 → 安装。
填入:
github:Jun-Jun-Gao/dsh-token-usage-panel安装完成后会自动启用这个 bundle。若面板没立刻出现,刷新一次页面。
方式 B:命令行
# 1) 安装到你的 profile(desktop 为例;Web 版通常是 web)
dsh plugin --profile desktop add github:Jun-Jun-Gao/dsh-token-usage-panel

# 2) 把它选为 profile 的一层(bundle)
#    编辑 $DSH_HOME/profiles/desktop/package.json,在 dsh.profile.bundles 里加上:
#      "dsh-token-usage-panel"
第 2 步等价于让它出现在「插件」页被勾选;改完 DSH 会热重载,或重启应用生效。
方式 C:本地开发 / 手动
git clone https://github.com/Jun-Jun-Gao/dsh-token-usage-panel.git
dsh plugin --profile desktop add link:/绝对路径/dsh-token-usage-panel
# 然后在 profile 的 cordis.patch.yml 插入一行(不想选 bundle 时这样也行):
#   - insert:
#       - id: ui-settings-token-usage
#         name: 'dsh-token-usage-panel'
使用
打开 DSH 设置,左侧导航里选 Token 用量。
- 热力图按本机时区的自然日归档;颜色分 4 档,按「当天消耗 / 历史单日最大值」划分。
- 面板默认每 30 秒自动刷新一次,也可以点「刷新」;正在进行的会话也会被算进去。
- 「成本估算」四个单价留空即不显示金额;
清空按钮会清掉本机保存的价格。
统计口径
| 字段 | 含义 |
|---|---|
| 未缓存输入 | 真正按输入价计费的 prompt token |
| 缓存命中 | 命中 prompt cache 的部分(单价通常最低) |
| 输出 | 模型生成的 token(含思维链) |
| 合计 | 以上四项之和,也就是服务商后台看到的那个总量 |
因为每一步都会重发上下文,「合计」通常被缓存命中主导(实测占比 99%+), 所以真正贵的是「未缓存输入 + 输出」两项——面板把它们单独列出来就是为此。
工作原理
DSH Host 进程                                 浏览器
┌───────────────────────────────┐            ┌────────────────────────────┐
│ lib/index.js                  │            │ lib/client.js              │
│  · 扫描 $DSH_HOME/sessions/   │  GET       │  · 注册 settings.section   │
│    **/session*.jsonl.zstd     │ ─────────► │  · 拉取数据并渲染面板      │
│  · 聚合到「每天 / 每会话」     │ /token-    │  · 成本估算存 localStorage │
│  · 注册只读路由 /token-usage  │  usage/data│                            │
└───────────────────────────────┘            └────────────────────────────┘
- 数据来源是 DSH 自己写的会话日志里,每一条
assistant/message的usage字段。 - 这些日志是多帧拼接的 zstd 文件(每追加一次一个帧),而 Node 的
zlib.zstdDecompressSync只解第一帧。所以 Host 侧按 zstd 魔数切帧、逐帧解压,并在误切时自动合并重试—— 不需要外部zstd命令。 - 解析结果按「文件大小 + mtime」做增量缓存,历史会话再多刷新也很快。
- 只读本机文件,不联网、不上传,也不注册任何模型可见的东西(模型看不到这个面板)。
卸载
dsh plugin --profile desktop remove dsh-token-usage-panel
# 并在 profile 的 package.json 里把 "dsh-token-usage-panel" 从 dsh.profile.bundles 移掉
兼容性
- 开发与验证环境:DSH 0.2.0-rc.2(Electron 44 / Node 24.18)下的 Web GUI 与桌面版。
- 本包没有声明
@deepseek-ai/dsh*的 peerDependencies,所以不会被版本范围拒装; 如果你在更新的 DSH 上遇到问题,欢迎开 issue 附上 DSH 版本。 - 面板用的是
settings.section、ctx.locale、ctx.webServer.register这几个公开扩展点。
开发
# Host 侧可以脱离应用单独跑(会打印扫描结果)
ELECTRON_RUN_AS_NODE=1 "/Applications/DeepSeek Harness.app/Contents/MacOS/DeepSeek Harness" lib/index.js

# 应用运行中时,直接看接口:
curl -s http://127.0.0.1:<dsh-web-port>/token-usage/health
curl -s http://127.0.0.1:<dsh-web-port>/token-usage/data | head -c 300
lib/index.js:Host 侧(扫描 + 聚合 + 路由),零依赖。lib/client.js:浏览器侧,一个自带CSS常量的自包含 bundle(window.__ModuleLoader__.load), 只require('react')(DSH 的 platform seed 提供)。- 改完代码后 touch 一下 profile 的
cordis.patch.yml让 DSH 热重载,或重启应用。
提交前可以跑一下 CI 同款检查:
npm run check # 语法 + DSH 清单校验
English
dsh-token-usage-panel adds a Token usage section to DeepSeek Harness settings: today's usage with a per-kind breakdown, a GitHub-style 53-week daily heatmap (click a cell for that day's per-session split), a stacked 30-day chart, sortable session details and an optional cost estimate.
Install from the DSH Plugins page with github:Jun-Jun-Gao/dsh-token-usage-panel,
or dsh plugin --profile <profile> add github:Jun-Jun-Gao/dsh-token-usage-panel and
select dsh-token-usage-panel in dsh.profile.bundles.
The host half reads the session logs under $DSH_HOME/sessions/ (nothing leaves
your machine) and serves them at GET /token-usage/data; the client half renders
inside the settings sheet and follows DSH's own light/dark design tokens.
No comments yet. Be the first to write one.