🌐 简体中文 | English
dsh-antv-ava
Present data conclusions and charts in DeepSeek Harness, with optional file uploads and computed analysis.








Preview
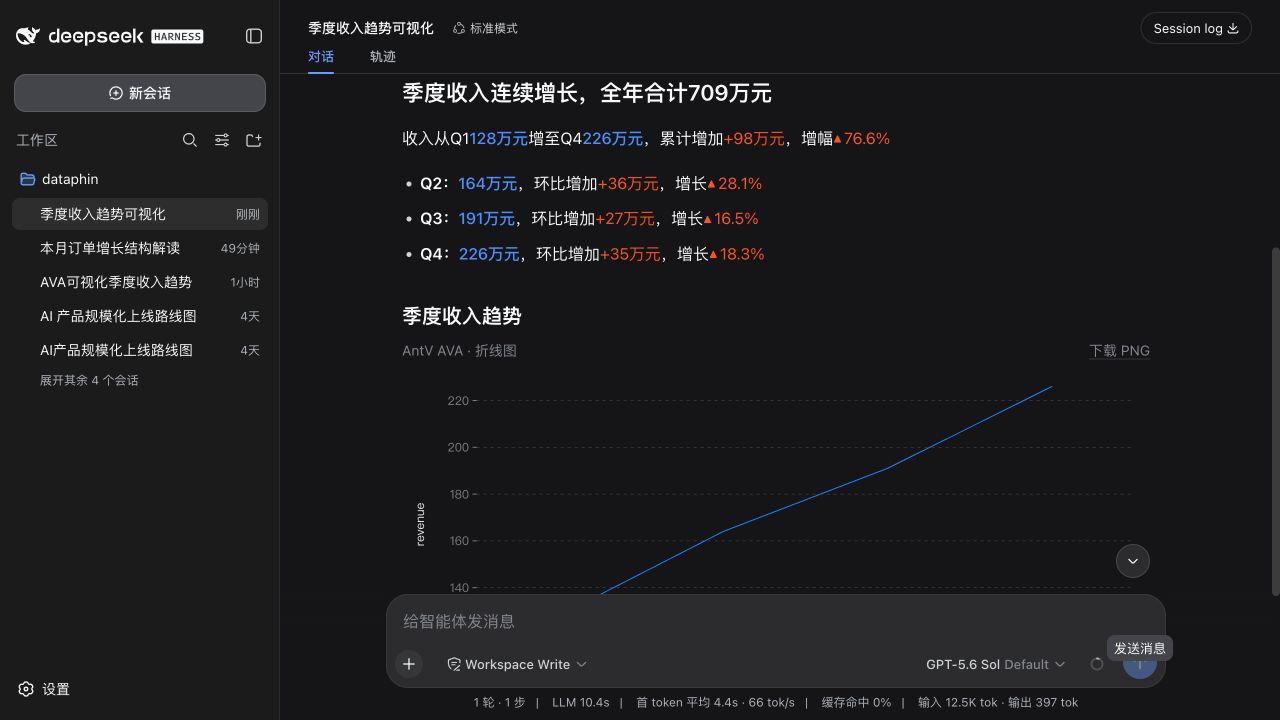
Text and charts flow with the conversation. Supplied figures render progressively; file analysis executes queries first, then presents saved results, a data table, and calculation evidence.
Installation
| Component | Responsibility | Runtime |
|---|---|---|
dsh-antv-ava |
Narrative, charts, tables and result replay | Node.js ≥20.11 |
Optional dsh-antv-ava-runtime |
Session uploads, workspace files, AVA v4 / DuckDB queries and snapshots | Node.js ≥22.13 |
For visualization of supplied numbers, install the base plugin:
dsh plugin --profile web add dsh-antv-ava@0.3.2 --ignore-scripts
To analyze pasted/uploaded files, also install the runtime:
dsh plugin --profile web add dsh-antv-ava-runtime@0.1.2 --ignore-scripts
Both distributions are prebuilt. --ignore-scripts skips unused optional SSH accelerator builds pulled in by AVA and avoids pnpm 11 refusing an undeclared build.
Both packages are published to npm from the same GitHub Release, using separate package-level Trusted Publishers. The runtime depends on the exact base protocol version; both plugins are enabled separately in the web profile. The release also retains the runtime archive and SHA256SUMS as an alternative distribution.
Tested with DSH 0.1.0-rc.8 and 0.2.1-rc.2. Use 0.2.1-rc.2 for file upload support. Restart dsh web and refresh the browser after installation. On first access, open the complete login URL printed by DSH. AVA needs no additional model key: the existing DSH model plans the analysis.
Usage
Supplied figures:
Analyze quarterly revenue and plot the trend: Q1 128, Q2 164, Q3 191, Q4 226, all in thousands of USD.
Pasted or uploaded Excel:
Use AVA to analyze the sales.xlsx I uploaded. Sum revenue by product, create a column chart, and explain the result.
A file in the current workspace:
Use AVA to analyze tests/fixtures/sales.xlsx and sum revenue by product.
Relative paths resolve against the current DSH session workspace. Uploads are read directly without copying them into the project or a temporary directory. Only admitted file references from that conversation grant attachment access; ambiguous filenames require an explicit selection.
The model chooses narrative, charts, or both. Ask for a chart only when desired. Normal users do not need to write the output protocol or install a separate skill.
Capabilities
- Streaming presentation: complete narrative phrases appear progressively; inline charts update as complete data lines arrive.
- File analysis: the optional runtime supports CSV, JSON and XLSX, schema/profile inspection, and read-only DuckDB SQL.
- Consistent results: narrative values and charts bind to the same query result. Tables, pagination, CSV export and query inspection do not rerun analysis.
- History replay: host snapshots survive dataset closure and runtime restarts.
- Themes and recovery: DSH typography, light/dark themes, table fallback on chart failure, and independent chart retry.
- Optional statistics: legacy inline charts retain explicit AVA 3.4.1 pattern computation. Loading, resizing and theme changes never automatically run it.
- Bounded execution: isolated processes, cancellation/deadlines, input/result limits, and explicit truncation notices.
Charts use GPT-Vis 1.0.0. Legacy inline syntax retains its existing chart coverage; the new JSON/result-binding path supports line, bar, column, pie, scatter, histogram, waterfall and table. See the runtime guide for limits, configuration, storage and access rules.
The current execution path uses the DSH Agent to write queries and AVA to compute them. Additional model-driven analyze/recommend/suggest, remote databases, multiple sources and Python execution are not integrated yet.
Output protocol and compatibility
Existing ava, ava ntv, and ava chart fences remain supported:
```ava
ava
language en-US
narrative
  headline Quarterly revenue increased
  paragraph
    text Q4 revenue reached
    metric-value 226k USD
chart
  vis column
  data
    - category Q1
      value 128
    - category Q4
      value 226
  title "Quarterly revenue"
  axisYTitle "Revenue (thousand USD)"
```
Additional entry points:
| Content | Purpose |
|---|---|
ava json followed by JSON |
GPT-Vis config or AVA v4 { chartType, config }; HTML is never executed |
ava answer followed by JSON |
Plugin-owned schemaVersion: 1 document with results, value references and views |
ava result <id> |
Replay a host-generated presentation snapshot; normally emitted directly from a tool result |
Inline supplied snapshots are marked as having unverified execution provenance. When DSH 0.2 hides unknown language names behind a generic code-block banner, the compatibility adapter validates the AVA content before taking over. Explicit non-AVA language hints remain authoritative.
Source development
git clone https://github.com/HellowVirgil/dsh-antv-ava.git
cd dsh-antv-ava
pnpm install --frozen-lockfile
pnpm run check
dsh plugin --profile web add "link:$PWD"
dsh plugin --profile web add "link:$PWD/runtime"
pnpm dev
The preview executes real AVA queries on synthetic data, closes the dataset, and replays the saved result.
pnpm run verify:pack
pnpm run pack:runtime
pnpm run verify:dsh
pnpm run verify:dsh-uploads
The last two checks require an installed DSH; upload verification requires its file-attachment capability. Set AVA_TEST_DSH_BINARY to select a DSH executable. Checks use isolated contexts and leave the existing web profile unchanged. The bundled SKILL.md is optional for skill-aware agents.
Publishing
GitHub Release is the entry point. publish.yml installs, checks and packs the immutable release tag, attaches the runtime archive and SHA256SUMS, then publishes the base package and runtime through their separate npm Trusted Publishers. See AGENTS.md.
License
MIT. AntV AVA and AntV GPT-Vis are also MIT licensed.
No comments yet. Be the first to write one.