🌐 简体中文 | English
dsh-antv-ava
Let DeepSeek Harness automatically present data-heavy answers as streaming narrative text, AntV charts, or a natural combination of both.








Preview
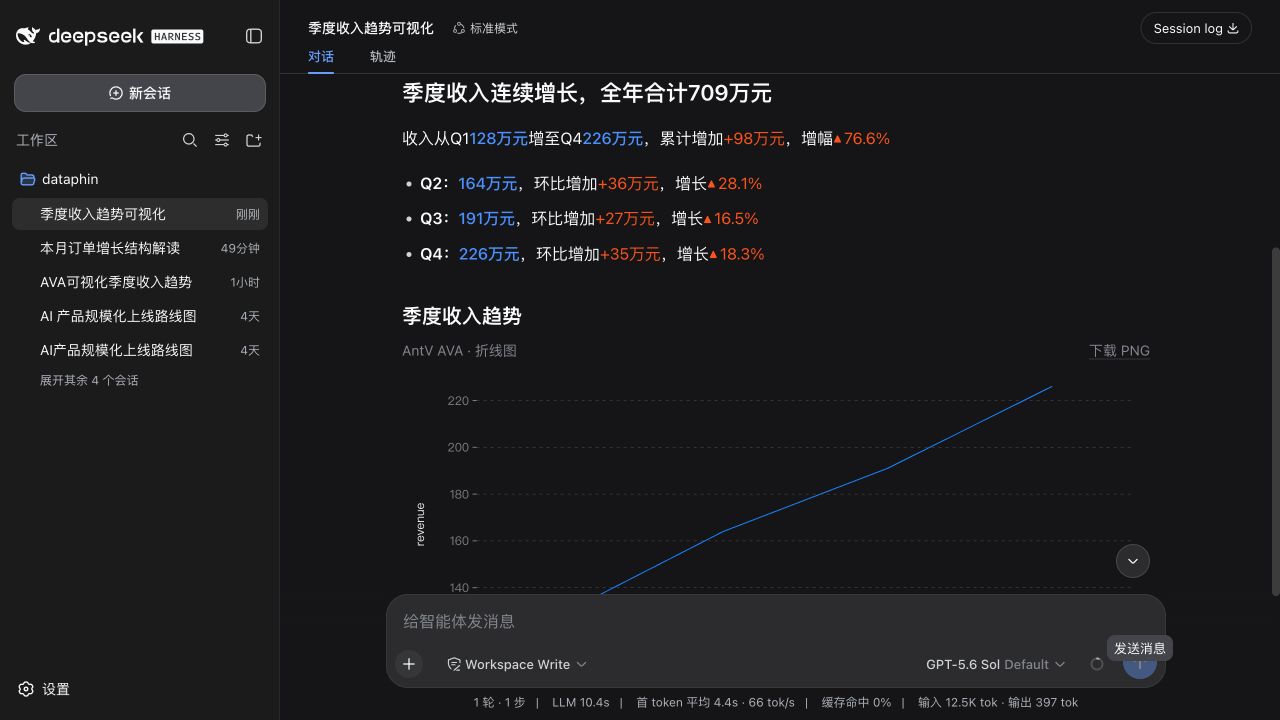
Narrative text and charts flow directly with the model reply instead of appearing in separate cards. Text renders phrase by phrase, while GPT-Vis charts appear as soon as usable data arrives and keep updating during generation.
Core features
- Automatic presentation selection: the model chooses NTV, a chart, or both based on the question and data.
- Streaming data interpretation: metrics, changes, shares, category details, and conclusions render phrase by phrase.
- Streaming AntV charts: the model emits official GPT-Vis syntax, and complete data lines update the mounted chart before the answer finishes.
- AVA insights: AVA inspects stable tabular results after generation and can surface significant trends, outliers, changes, shares, and correlations.
- Conversation-native design: inherits DSH typography, font size, line height, color, width, and Markdown spacing.
- Live theme adaptation: chart axes, labels, and grid lines update when switching between light and dark themes without a page refresh.
- Semantic data expression: highlighted metrics, direction arrows, absolute changes, rates, contributions, and proportion micro charts.
- Lazy loading: the AVA/GPT-Vis chart engine loads only when an answer contains a chart.
- Safe parsing: source-size limits and blocking for executable markup, dangerous URLs, and private-network resources.
Installation
dsh plugin --profile web add dsh-antv-ava
Restart dsh web and reload the page after installation. The plugin injects the required output contract automatically, so regular users do not need to install a separate Skill or write DSL by hand.
Usage
Ask naturally after installation.
Interpret data
Interpret the following business data and provide concise, easy-to-scan conclusions:
Total orders reached 198M this month, up 7.05% year over year…
The model will usually return streaming NTV with emphasized metrics, changes, shares, and category conclusions.
Interpret and visualize
Analyze the revenue change from Q1 to Q4 and choose an appropriate visualization:
Q1 1.28M, Q2 1.64M, Q3 1.91M, Q4 2.26M.
When visual shape makes a trend or comparison easier to understand, the model combines narrative text with a chart.
Generate only a chart
Plot the following data as a trend chart. Return only the chart: …
When explicitly requested, the model can return a chart without repeating the same information as narrative text.
Automatic output selection
| Content | Typical result |
|---|---|
| KPIs, period-over-period changes, shares, category breakdowns, and conclusions | NTV |
| Trends, comparisons, distributions, rankings, or compositions benefit from shape | NTV + Chart |
| The user explicitly requests only a chart, or narrative adds no value | Chart |
This selection is automatic; users do not need to understand the internal format.
Supported data expression
NTV supports:
- Primary and secondary metrics and dimension values
- Time descriptions and trend conclusions
- Absolute changes and change rates
- Shares, contributions, and inline proportion micro charts
- Headlines, heading levels 1–6, paragraphs, bullets, sections, and dividers
Charts use GPT-Vis syntax and support:
- Line, area, column, bar, pie, scatter, radar, funnel, waterfall, and dual-axis charts
- Histograms, boxplots, violin plots, treemaps, Sankey diagrams, Venn diagrams, liquid charts, word clouds, and tables
- Additional GPT-Vis relationship diagrams accepted by the renderer when they are useful for data interpretation
Optional Skill installation
The plugin works on its own. Install the bundled Skill only when the agent environment discovers ~/.agents/skills and complex data tasks need stricter guidance for fact preservation and presentation selection.
mkdir -p ~/.agents/skills/antv-ava
cp SKILL.md ~/.agents/skills/antv-ava/SKILL.md
Advanced: unified AVA format
The model can emit narrative, chart, or both inside one ava fence:
```ava
ava
language en-US
narrative
  headline Quarterly revenue continued to grow
  paragraph
    text Q4 revenue reached
    metric-value 2.26M
    text , up from Q1 by
    ratio positive 76.6%
chart
  vis line
  data
    - time Q1
      value 1.28
    - time Q4
      value 2.26
  title "Quarterly revenue trend"
  axisXTitle Quarter
  axisYTitle "Revenue (M)"
```
Scope
Use the plugin for evidence-backed KPIs, business analysis, trends, shares, rankings, and category breakdowns. It does not invent values for visualization and never executes arbitrary HTML, SVG, or scripts emitted by the model.
Processes, hierarchies, and roadmaps without meaningful numeric structure are better suited to an infographic plugin.
Install from source
git clone https://github.com/HellowVirgil/dsh-antv-ava.git
cd dsh-antv-ava
pnpm install
pnpm run check
dsh plugin --profile web add "link:$PWD"
Development
pnpm test
pnpm build
pnpm run verify:pack
License
MIT. AntV AVA and AntV GPT-Vis are also licensed under MIT.
No comments yet. Be the first to write one.